14
$\begingroup$

I have a dataset consisting of 4 classes and around 200 features. I have implemented a Gaussian Naive Bayes classifier. I want now calculate the importance of each feature for each pair of classes according to the Gaussian Naive Bayes classifier. In the end, I want to visualize the 10 most important features for each pair of classes. That means for class 1 vs class 2, I want the importance of feature 1, feature 2, etc.

My proposal would be to calculate $\log\frac{P(X_n|Y=i)}{P(X_n|Y=j)}$ for each pair of classes.

I have calculated the mean and variance for each feature and each class. That means I have a mean and variance for each of the 200 features and each of the 4 classes. Taking the normal distribution I can classify a new data point.

How would you now calculate the feature importance measure?

Let's say we calculate $\log\frac{P(X_1|Y=1)}{P(X_1|Y=2)}$, that means the first feature ($X_1$) and class 1 and class 2, so it should give the importance of the first feature for class 1 and class 2.

I have both the normal distribution for the first feature for class 1 and class 2 but how should I calculate the probability, i.e., at which point should I evaluate the normal distribution?

$\endgroup$

3 Answers 3

1
$\begingroup$

The discriminative value of a feature is based on its statistical distance between classes.

I have calculated the mean and variance for each feature and each class

Using your feature $i$ class $j$ estimated mean $\hat{\mu}_{i,j}$ and estimated variance $\hat{\sigma}_{i,j}^2$, one approach would be to compute the symmetric KL divergence for each feature for two classes you compare. The largest distance between feature distributions is the best discriminative feature for that pair.

KL divergence for two normal distributions is easy to compute.

$\endgroup$
3
  • $\begingroup$ something like a cohen's D per variable should be enough, no? $\endgroup$
    – rep_ho
    Commented Jun 4, 2021 at 13:15
  • $\begingroup$ @rep_ho - I use KL regularly, not familiar with Cohen's D. A quick glance here gives the impression that distinct variance for two classes is not as carefully addressed with Cohen's D as it is with KL divergence. "should be enough" - I'll re-emphasize KL calculations given Gaussian parameters ($\mu$ and $\sigma^2$) are very straight forward, not a burden. $\endgroup$
    – krkeane
    Commented Jun 4, 2021 at 13:44
  • $\begingroup$ oh yes, that's a good point. Cohen's wouldn't discriminate between distributions with the same mean but different variance, even tho they can be very important for NB $\endgroup$
    – rep_ho
    Commented Jun 4, 2021 at 13:48
0
$\begingroup$

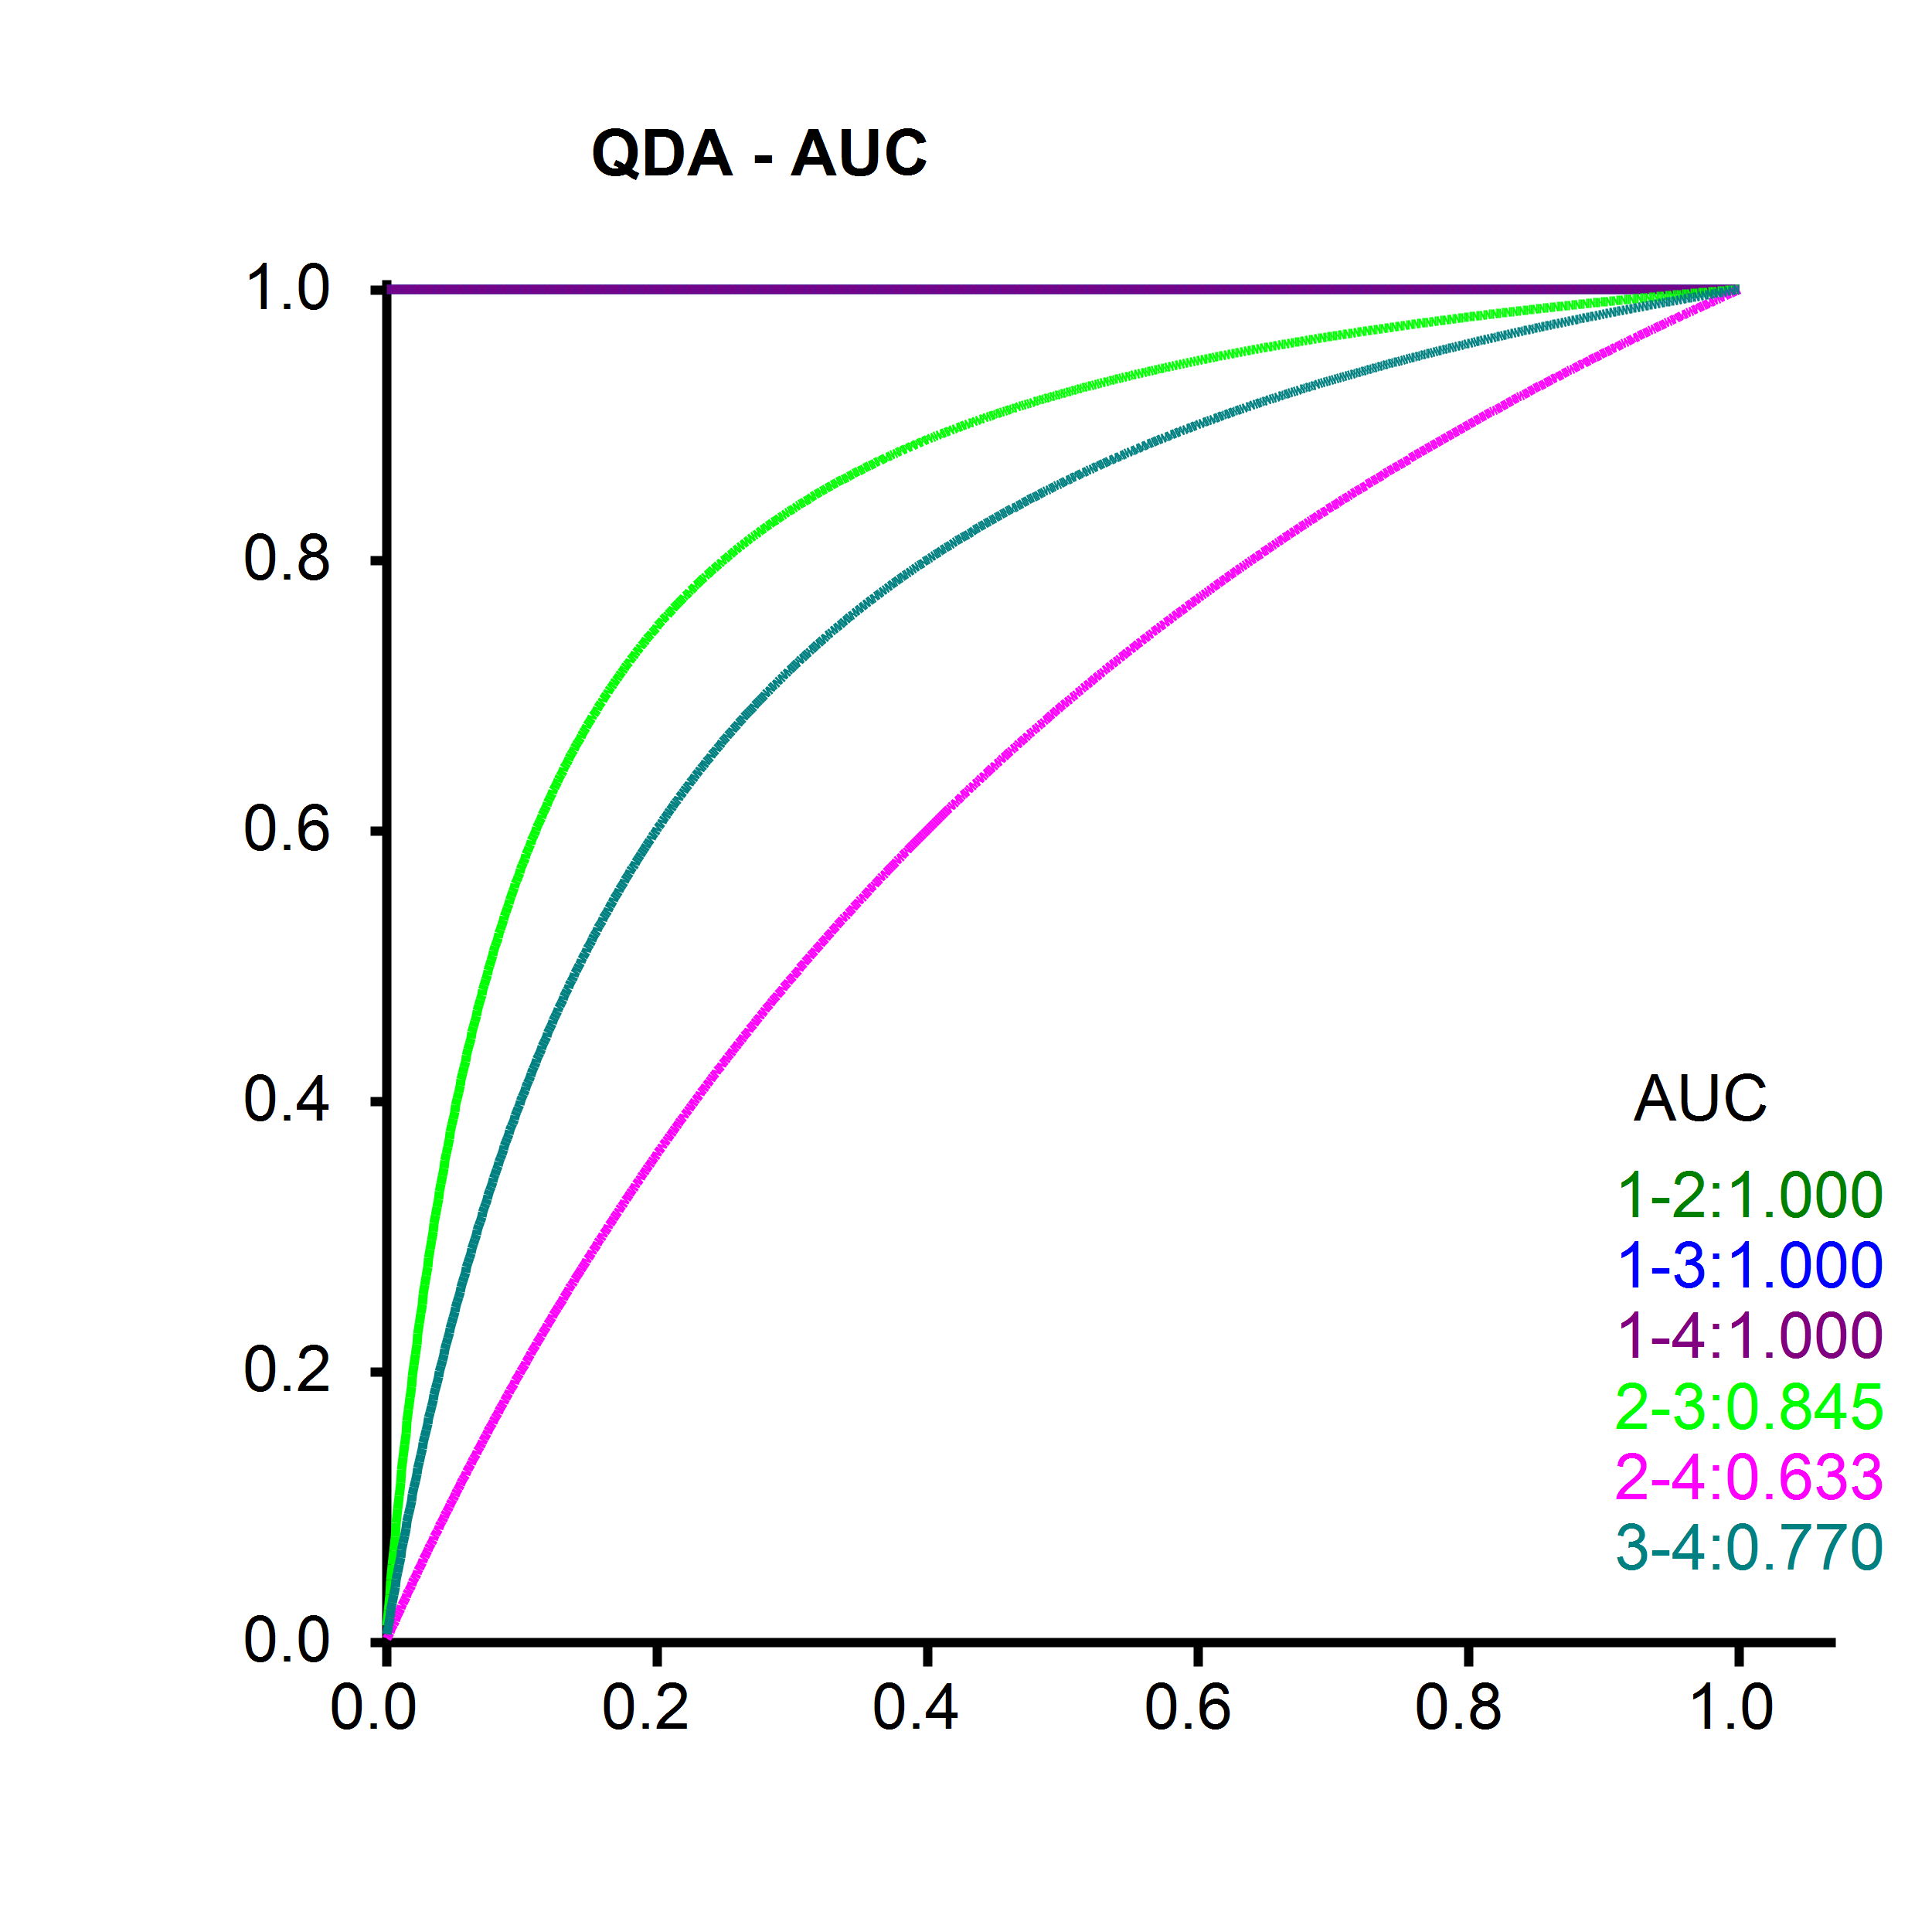
I would determine the ROC-AUC for all possible class comparisons using each feature as a separate input. Below is an ROC-AUC plot of AUC curves for all possible class comparsons for a 4-class problem, but it's based on a run with multiple features.

enter image description here

$\endgroup$
0
$\begingroup$

I wrote my own feature importance method using Naive Bayes for which I will present here. The proposal is a bit expensive computationally because you basically have 6 binomial models.

  1. Split data into (80 / 20) (training / test iterations). Repeat the following steps 25-50 times.

  2. For each iteration and each pair of classes (binomial), create a binomial model:

A. Train a classifier on the 80, test on the 20. This is your base level performance.

B. (Repeat this step 200 times, once for each feature). Permute/shuffle the labels for one feature at a time in the training data. Re-train classifier and score test set. Record drop in performance. Shuffling the labels for a specific feature breaks the correlation between feature and label. The more "important" features will have a larger drop in performance across the 25-50 different iterations.

$\endgroup$

Your Answer

By clicking “Post Your Answer”, you agree to our terms of service and acknowledge you have read our privacy policy.

Not the answer you're looking for? Browse other questions tagged or ask your own question.