5
$\begingroup$

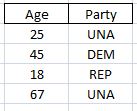
I have a data frame with 1 vector of integers and 1 as a character factor like so:

enter image description here

I have created a linear model that shows a relationship between age and party affiliation. I now want to determine the best bins of ages (50-59, 60-69, etc..) that can explain party affiliation. Is there an R package/model that can help me do that?

$\endgroup$
2
  • 8
    $\begingroup$ I would suggest not binning a continuous variable since this is needlessly throwing away information in general. Can you explain your actual model? You seem to have a class variable with several levels as the response, so how did you fit a linear model? $\endgroup$
    – dsaxton
    Commented Aug 11, 2015 at 2:16
  • 1
    $\begingroup$ Simply asking for functions / packages is off topic here. You may want to look into Fisher's Linear Discriminant Analysis (Quick-R), though. $\endgroup$ Commented Aug 11, 2015 at 2:26

2 Answers 2

4
$\begingroup$

You might try a regression tree with party as response and age as independent variable.

>temp <- rpart(Party ~ Age)
>plot(temp)
>text(temp)

The algorithm will find suitable places to split the Age variable, if these exist. If not, the tree won't grow past the root stage, which would tell you something.

$\endgroup$
3
$\begingroup$

(For the record, I agree with @dsaxton. But just to give you something, here is a quick demonstration of using LDA to optimally bin a continuous variable based on a factor.)

library(MASS)

Iris  = iris[,c(1,5)]
model = lda(Species~Sepal.Length, Iris)
range(Iris$Sepal.Length)  # [1] 4.3 7.9
cbind(seq(4, 8, .1), 
      predict(model, data.frame(Sepal.Length=seq(4, 8, .1)))$class)
#       [,1] [,2]
#  [1,]  4.0    1
#  [2,]  4.1    1
#        ...
# [15,]  5.4    1
# [16,]  5.5    2
# [17,]  5.6    2
#        ...
# [23,]  6.2    2
# [24,]  6.3    3
# [25,]  6.4    3
#        ...
# [41,]  8.0    3
$\endgroup$
2
  • 1
    $\begingroup$ Neat idea. I'm not sure if there is a universal equivalence, but making the class predictions via a multinomial model results in the same predictions for your Iris example. Example here. That has an example plot to show uncertainty in the predictions as well. $\endgroup$
    – Andy W
    Commented Aug 11, 2015 at 13:10
  • $\begingroup$ @AndyW, they are similar but won't be universally equivalent. LDA assumes age is normally distributed; if so, it will work slightly better--especially as the distributions get further apart. MLR can handle categorical variables (sex, race, etc) as well, so can be more generally applicable, but it seems to me a little more advanced to understand & use (although your example was very straightforward, so maybe not). MLR is a viable option; you could add it as an answer, if you wanted. $\endgroup$ Commented Aug 13, 2015 at 1:11

Your Answer

By clicking “Post Your Answer”, you agree to our terms of service and acknowledge you have read our privacy policy.

Not the answer you're looking for? Browse other questions tagged or ask your own question.