There are several components to your question. These include (but are not limited to): 1) constrained variable selection when the number of observations (n) is small relative to the number of predictors (p), 2) heuristic selection vs optimization, 3) dealing with mixtures of distributions among the predictors, 4) comparison of the fit between predicted and actual, 5) finding an appropriate model for y, and 6) separating statistical understanding from pure, machine learning prediction.
I'm not an advocate of optimizing approaches to variable selection as wasteful of CPU. Moreover, given the smallish n and p which is not so big anyway, I think leveraging an RF would be methodological overkill. A more useful model-building step (assuming some exploratory work has been done to assess whether or not applying transformations improves the fit) would be heuristic evaluation of pair-wise relationships between y and the candidate predictors. The idea here is that if a potential predictor does not have at least a modestly significant relationship with y, then it probably can be eliminated. This could be done in an ANOVA-type context using a relaxed significance of p<=.15 or so for inclusion. Of course, causal purists would argue that tertiary (masking) and/or interaction effects can be lost this way but, in practice, these tertiary effects are usually small if they are significant at all. Besides, a better guide to including tertiary effects is prior theoretical insight. The advantage of using ANOVA is that it is invariant to the scale (mixture) of distributions, providing a measure (the F-statistic) of relative effect sizes leading to an preliminary importance ranking in selecting predictors. Of course, ANOVAs use linear assumptions. If you think the relationships are nonlinear then there are many tools now for evaluating nonlinear dependence but these require a level of sophistication that your question belies.
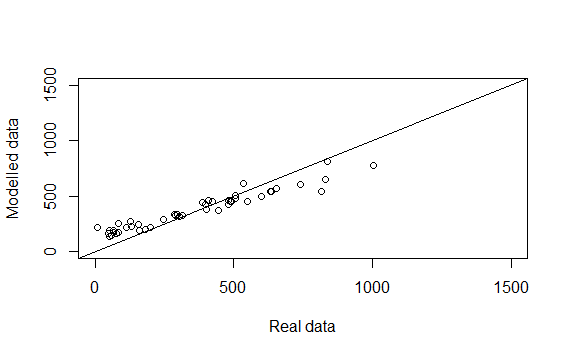
The under/over weighting you point out in the scatterplot is a bit of a red herring since it's benchmarked against an orthogonal, 45-degree line. The better comparison would be to an average line of best fit, which would be demonstrably balanced.
In terms of appropriate models for your data, I don't see any reason why classic OLS estimation wouldn't provide reasonable insight. Of course, there are other methods such as partial least squares which are designed specifically for situations where p>>n but your mixture of distributions precludes their use.
You haven't indicated what your "high-level" goal is. Are you simply trying to find a good, predictive fit or are you trying to uncover some underlying process in order to gain insight into causality? Either way, by choosing predictors that maximize the predictive fit, you have put a stake in the ground in terms of understanding causality.
Final model variable selection would be based on those variables that passed the threshold of relaxed significance and could be identified using the lasso, a widely available variable selection method.

