0
$\begingroup$

I know this is a small sample but it's all I got.

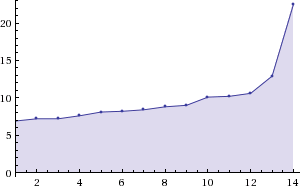
6.9, 7.2, 7.2, 7.6, 8.1, 8.2, 8.4, 8.8, 9.0, 10.1, 10.2, 10.6, 12.9, 22.5

plot

Context: the numbers are waiting periods (in years) for people that are looking for housing. The person who waited the longest waited for more than 22 years.

In this case, housing is offered to the people who have the longest waiting period first. This is why it's a descending sequence of numbers. As a limited supply of housing is offered to people the minimum required waiting period for each person decreases.

I'm want to be able to predict the shortest (lowest) waiting period in this sequence. I know the length of the sequence since I know the number of objects available for each housing project. I have data to cross validate against, like how many people have waited X years in total. And waiting periods for similar housing from past years in similar areas. But I'm not sure how I would go about bringing these together to create a good predictor.

Basically how would I go about doing forecasting for something like this? I tried regression analysis but it didn't yield anything good.

$\endgroup$
4
  • $\begingroup$ 1 What do you mean by "descending number" there? $\:$ 2. Are you assuming the waiting times you have to be independent draws from the distribution of times that the next value will be drawn from? Assuming no censoring (e.g. that people don't give up on waiting and do something else ... -- like die first), it's a simple question. Otherwise it depends on what else you assume about the situation. $\endgroup$
    – Glen_b
    Commented Nov 5, 2015 at 0:53
  • $\begingroup$ In this case housing is given to the people who have the longest waiting period first. This is why it's a descending sequence of numbers. As a limited supply of housing is offered to people the minimum required waiting period for each person decreases. $\endgroup$ Commented Nov 5, 2015 at 9:14
  • $\begingroup$ This is vital information; my previous thoughts on the question don't really apply. Please edit your question to include the information. $\endgroup$
    – Glen_b
    Commented Nov 5, 2015 at 9:33
  • $\begingroup$ @Glen_b done. I also rephrased my question because lower than 6.6 is just a specific case, something I can determine if I can predict the sequence with a reasonable margin of error. $\endgroup$ Commented Nov 5, 2015 at 12:04

1 Answer 1

2
$\begingroup$

You could treat this as a survival analysis assuming you know both how long people who have been successful in obtaining housing have had to wait as well as how long people who are still waiting for housing have been queued. In survival analysis, this latter group are called "censored" observations meaning that information as to their status wrt obtaining housing is not available as of the last period in the time series. Survival analysis is a class of models developed specifically for those special cases in predictive modeling where data are censored.

One excellently written and intuitive introduction to this class of models is Paul Allison's Survival Analysis Using SAS: A Practical Guide, Second Edition. This book covers the waterfront from the simplest Kaplan-Meier survival curves through parametric failure models to Cox proportional hazards models. Forget about the fact that it is focused on SAS software, Allison's development and overview of the methods is software agnostic in most important respects. In other words, while it would be nice to know and use SAS software in the context of his book, it remains a highly useful resource without it.

What is problematic about your specific question is that it asks for a likelihood of a value less than anything in your observed data. While this is theoretically possible, the usual caveats apply when extrapolating to data outside the observed range of any reference information.

$\endgroup$
1
  • $\begingroup$ My method may very well be flawed. All I really want to know is the probability of being offered housing in an area given the waiting periods. In this case 6.6 just refers to a specific cutoff in my case. I thought asking for the likelihood for it being lower was the right thing to do. $\endgroup$ Commented Nov 5, 2015 at 9:23

Your Answer

By clicking “Post Your Answer”, you agree to our terms of service and acknowledge you have read our privacy policy.

Not the answer you're looking for? Browse other questions tagged or ask your own question.