12
$\begingroup$

As at In classification with 2 - classes, can a higher accuracy leads to a lower ROC - AUC?, AdamO said that for random forest ROC AUC is not available, because there is no cut-off value for this algorithm, and ROC AUC is only calculable in the case if the algorithm returns a continuous probability value (and only 1 value) for an unseen element.

But in R and Python, it is very often, such as pROC::auc in R, or roc_auc_score in sklearn in python, we can calculate ROC AUC after we have predicted results, i.e. ROC AUC is available for all algorithms.

Summary: Why ROC AUC is not available for random forest (in case of classify True/False label)

the idea of AUC is: if you change the cut-off value, the assignment will change. For instance, in regression, a predict value for an object is 0.75 and the cut-off value is 0.8, it will be assign to False (0) and if the cut-off value is 0.6 it will be assigned to True (1).

But for randomForest, the assignment never change.

For instance with the function predict_proba, sklearn will return a list of probability for each class, not only 1 probability

So, let’s say sklearn returns for an unseen element

True        False
0.21        0.19

Whatever cut-off value changes, the assignment will always be True and never change.

$\endgroup$
2
  • 1
    $\begingroup$ randomForest and many of its implementations can output probabilities or pseudo-probabilities to construct ROC curves with. It is fairly common. $\endgroup$
    – charles
    Commented Dec 30, 2015 at 2:40
  • 1
    $\begingroup$ one example of that: stats.stackexchange.com/questions/157714/… $\endgroup$ Commented Dec 30, 2015 at 18:36

2 Answers 2

13
$\begingroup$

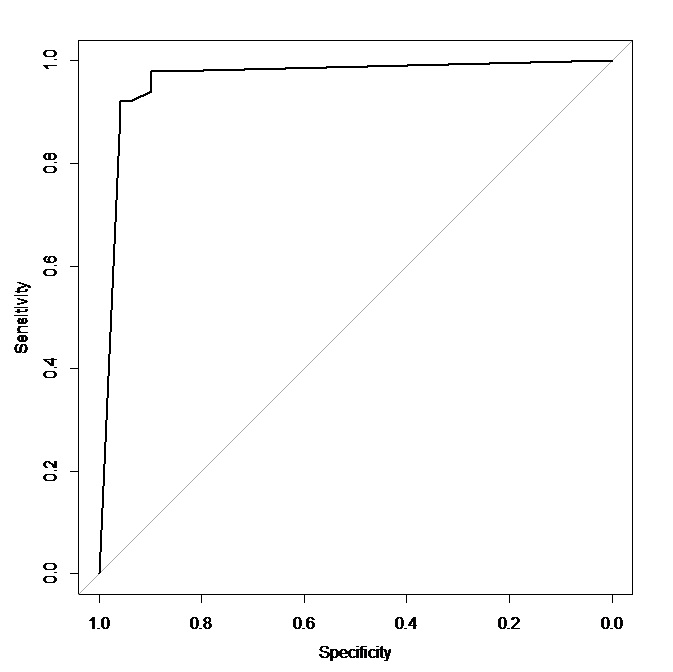
Although the randomForest package does not have a built-in function to generate a ROC curve and an AUC measure, it is very easy to generate in a case of 2 classes by using it in combination with the package pROC.

The randomForest function will create an object that contains votes. These votes are based on the Out of Bag (OOB) sample tree classification votes for each data point. These votes roughly represent a probability, and therefore can be used to create a ROC and AUC measure.

Here is an example, assuming the packages randomForest and pROC are installed:

require(randomForest)
data(iris)

# This will make drop a class to make it a 2 class problem
iris<-iris[-which(iris$Species=="setosa"),]
iris$Species<-as.factor(as.character(iris$Species))

set.seed(71)
iris.rf<-randomForest(Species ~ ., data=iris,ntree=10)
require(pROC)
rf.roc<-roc(iris$Species,iris.rf$votes[,2])
plot(rf.roc)
auc(rf.roc)

enter image description here

$\endgroup$
1
  • $\begingroup$ How to do it on validation set? $\endgroup$
    – AAAA
    Commented May 25, 2020 at 9:59
1
$\begingroup$

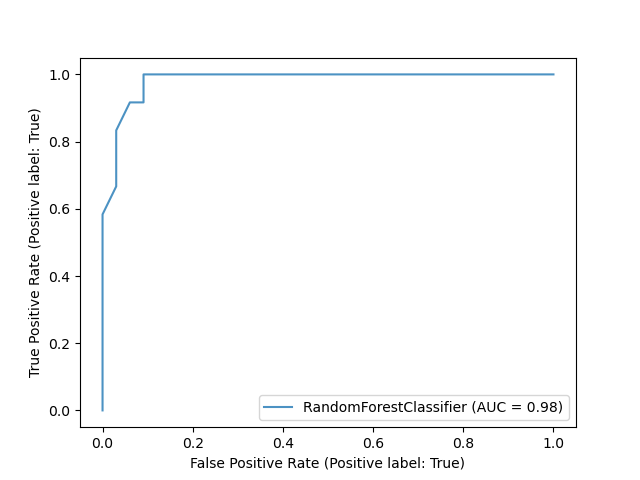
Scikit-learn has a ROC Curve with Visualization API which can be applied to random forest as well. I quote here the part of their code relevant to the random forest:

import matplotlib.pyplot as plt
from sklearn.datasets import load_wine
from sklearn.ensemble import RandomForestClassifier
from sklearn.metrics import RocCurveDisplay
from sklearn.model_selection import train_test_split

X, y = load_wine(return_X_y=True)
y = y == 2

X_train, X_test, y_train, y_test = train_test_split(X, y, random_state=42)

rfc = RandomForestClassifier(n_estimators=10, random_state=42)
rfc.fit(X_train, y_train)
ax = plt.gca()
rfc_disp = RocCurveDisplay.from_estimator(rfc, X_test, y_test, ax=ax, alpha=0.8)
plt.show()

with the result enter image description here

The value of AUC is available as rfc_disp.roc_auc.

If only the AUC is of interest (but not the ROC curve), one can also use roc_auc_score:

from sklearn.metrics import roc_auc_score
y_pred = rfc.predict_proba(X_test)[:,1]
auc = roc_auc_score(y_test, y_pred)
print(auc)
$\endgroup$

Not the answer you're looking for? Browse other questions tagged or ask your own question.