3
$\begingroup$

I've been a big fan of the gbm package for some time, but am having difficulty understanding the output from the partial dependence plots in the case for multinomial classification problems.

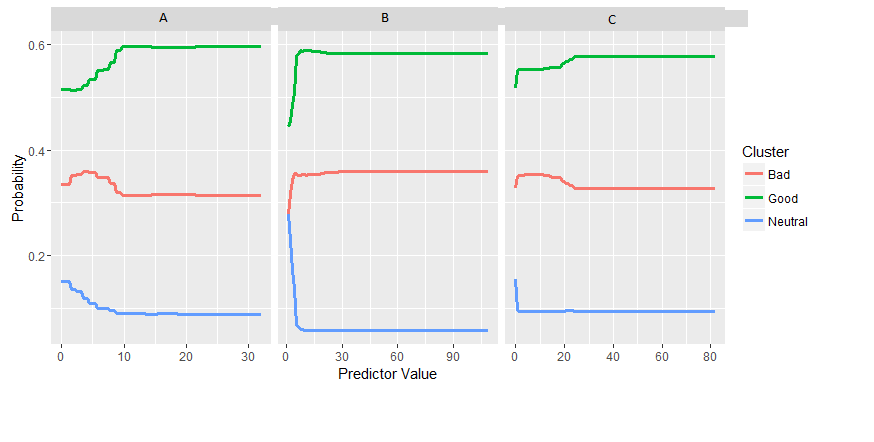
Below is the partial dependence plot for 3 of the many variables I'm considering:

My problem is that the probability for ‘Good’ is always much higher than the others (including on variables not pictured here), but it's not overly prevalent in the data OR in the predictions from the model. Here is some further output to clarify that point:

Confusion Matrix and Statistics

          Reference
Prediction  BAD MIDDLE GOOD
    BAD     875    107  163
    MIDDLE  150   1016  231
    GOOD    396    209 1651

Overall Statistics

               Accuracy : 0.7382         
                 95% CI : (0.7255, 0.7506)
    No Information Rate : 0.4262         
    P-Value [Acc > NIR] : < 2.2e-16      

                  Kappa : 0.5961         
 Mcnemar's Test P-Value : < 2.2e-16      

Statistics by Class:

                     Class: BAD Class: MIDDLE Class: GOOD
Sensitivity              0.6158        0.7628      0.8073
Specificity              0.9200        0.8901      0.7802
Pos Pred Value           0.7642        0.7273      0.7318
Neg Pred Value           0.8505        0.9071      0.8450
Prevalence               0.2962        0.2776      0.4262
Detection Rate           0.1824        0.2118      0.3441
Detection Prevalence     0.2386        0.2912      0.4702
Balanced Accuracy        0.7679        0.8264      0.7938

So while the model is able to correctly classify many of the targets as 'Neutral/Middle' (forgive my labelling), the partial dependence plots would suggest this hardly ever happens...

I'm guessing there is something obvious I have missed.. Any insight or thoughts would be hugely appreciated!

$\endgroup$

1 Answer 1

1
$\begingroup$

I would like more clarity on your data, but have this to work with.

Assumptions:

  • the clusters for "good", "neutral", and "bad" are the target disposition for the classifier
  • the variables "a", "b", and "c" are the independent variables trying to predict the class

Answer:
It looks like this is a multivariate nominal logistic, so there are more that 2 levels of output. They use a "winner takes all" approach so the values aren't as compatible. The highest probability value class wins, even if the expression gives the odds as 0.01, 0.001, and 0.0001. It is normalized by the sum. I don't think that is being shown well in your figure.

Note: There is a deep connection between a Classification tree and a multi/nominal regression. They might not be as mutually exclusive as they might seem. If it is outputting probability of membership, then it isn't simply breaking on a line. It may be that the probability is a supplied target, but that just means there are two connections, one at a superficial level and one a deep level.

$\endgroup$
1
  • $\begingroup$ The model was actually a boosted decision tree, but I believe your answer is still valid and reasonable. $\endgroup$
    – dcl
    Commented May 15, 2021 at 4:47

Your Answer

By clicking “Post Your Answer”, you agree to our terms of service and acknowledge you have read our privacy policy.

Not the answer you're looking for? Browse other questions tagged or ask your own question.