1
$\begingroup$

I'm using a linear mixed model with repeated measures to look at weight loss in groups of mice under various treatments. This has worked well, but in the present conditions we have groups of mice in which mortality is 100%; they survive for, say, 7 days and then have to be euthanized, while other treated groups have all or some members lasting through the end of the experiment (14 days).

I'm using SAS to calculate the probabilities. When at least one member of each group survives to 14 days, the program gives a between-group comparison, but when all members die, there is no group comparison. Obviously I don't expect comparisons for group-day effects after there are no members left, but it seems that there could be a comparison of the groups as a whole.

How can I approach this problem? Specifically, is there a way to use repeated measures when some but not all groups are completely removed partway through the study?

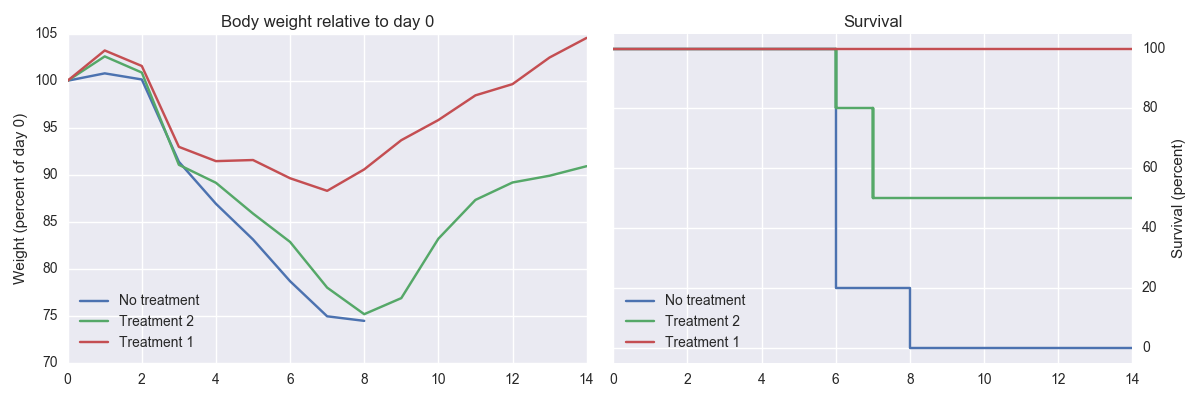
Edit to add an example figure:

enter image description here

In these figures, I would like to know whether Treatment 1 gives better survival than no treatment, whether Treatment 1 protects against disease (measured as weight loss) better than no treatment, whether Treatment 2 ditto, and also whether Treatment 1 gives better protection (both survival and weight loss) than Treatment 2.

Obviously, it's not possible to compare weight loss to "No treatment" after day 8. It should be possible before day 8, and it seems like it should be possible to compare Treatments 1 and 2 as groups, and/or after day 8. I've asked about repeated measures specifically, but the actual goal is to use whatever the most appropriate tool is to maximize information and thereby minimize animal use (i.e. animal distress); if there's a more suitable tag, let me know.

$\endgroup$
6
  • $\begingroup$ Why are they euthanised? Have you heard of joint modeling of longitudinal and time-to-event data? $\endgroup$
    – usεr11852
    Commented Mar 3, 2016 at 21:56
  • $\begingroup$ They are euthanized for humane reasons. I had not heard of joint modeling of longitudinal and time-to-event data, and would be interested in learning more; from what I can see from the link, the details are beyond me and I'd need a helpful R, SAS, or Python library to work through it. $\endgroup$
    – iayork
    Commented Mar 4, 2016 at 12:09
  • $\begingroup$ Cool... I like it when I know I am not the only one sacrificing his life in a study. (Horrible joke) There is a relatively well-known R packages on the matter. For example JM by Rizopoulos. Sorry, I am not experienced in SAS to help with something specific there. $\endgroup$
    – usεr11852
    Commented Mar 4, 2016 at 17:42
  • $\begingroup$ This does indeed look like a good solution. Feel free to turn it into an answer so I can accept it. $\endgroup$
    – iayork
    Commented Mar 4, 2016 at 17:46
  • $\begingroup$ ... though that said, while the JM package does offer some useful tools, unless I'm missing it it doesn't handle the exact scenario I have here, so other suggestions would be welcome $\endgroup$
    – iayork
    Commented Mar 4, 2016 at 18:27

2 Answers 2

1
$\begingroup$

The difficulty with your situation is that you do not have randomly missing data which a mixed effects can smear over. You have NO data past a certain time point for some groups.

Remember what your basic model is. The group comparison is the comparison of the groups AVERAGED OVER ALL TIMES! If some groups have no values on those times AND there is a TIME effect then your comparisons of "just" groups will be tremendously biased. And your model suggests that you believe, at minimum, that there is a time effect.

So you can no longer discuss "just" a group effect because the failure to have values over time in that group destroys the meaning of the group effect. You will have to model these missing design cells or you will have to partition your analyses to avoid them.

Partitioning: Analyze the data up to seven days for all groups. This may achieve what you want.

Modeling: You will need to include an indicator variable in the analysis and/or custom contrasts so that you analyze only meaningful contrasts.

$\endgroup$
1
  • $\begingroup$ Partitioning doesn't work very well (all animals lose weight through 7 days, but treated groups then recover and gain weight again while untreated groups don't recover -- partitioning would throw away the fact that treated mice recover). I don't understand the "Modeling" concept - could you point to examples or more detail? $\endgroup$
    – iayork
    Commented Apr 18, 2016 at 17:33
1
$\begingroup$

As @StatNoodle notes, the fundamental issue is in your model structure. (Note that even ANOVA is a type of "model" with underlying assumptions.) Looking for weight change at 14 days, for example, makes no sense on its own if most or all members of some treatment groups have died before then due to the treatment. Also, if some treatment groups lose and then regain weight, then what is your measure of weight change for such groups?

You have 2 outcomes to model, survival and weight change, and both need to be taken into account. You need to consider both the probability that a treatment leads to death and, if not, how treatment affects weight. I don't have experience with such modeling, but the joineR package in R provides "Analysis of repeated measurements and time-to-event data via random effects joint models." The vignette provides examples of how to use it.

Added in response to example plots

Your example plots illustrate the problem. Even for comparing weights under treatment 1 versus treatment 2, half of those receiving treatment 2 have died by 7 days. So after that time you are no longer comparing how 2 random samples from a population of animals differed in weight depending on treatment. You are comparing weights of a random sample of animals who received treatment 1 against the weights of the subset of sampled animals who happened to survive under treatment 2. Those surviving animals under treatment 2 no longer represent a random sampling from the underlying population, and the assumptions underlying usual statistical tests no longer hold (even if statistical software still gives results with p-values).

Focus first on the survival analysis. That is straightforward and I would argue most important. If you are still in the planning stage, there are many tools for survival-model power analysis into which you could enter your 14-day survival estimates of 100% (treatment 1), 50% (treatment 2) and 0% (no treatment) to determine group sizes needed to demonstrate the survival differences.

You certainly can describe the weights of the animals who survived under treatment 2, and make statements like "Among surviving animals under treatment 2, the average weight change at 14 days was -4 $\pm$ 1 gram, versus +2 $\pm$ 1 gram under treatment 1." If you are still in the planning stage you can use your preliminary data to estimate how big a 14-day change of weight among the surviving animals you can distinguish from a 14-day weight change of 0. Any statistical comparisons, however, have to incorporate that caveat: "among surviving animals under treatment 2..."

$\endgroup$
3
  • $\begingroup$ if some treatment groups lose and then regain weight, then what is your measure of weight change for such groups? I don't understand why this is a problem. We are comparing the weight loss at each day, not a cumulative measure. It's clearly wrong to say there's no useful way to analyze weight change on its own; there are ways to do it, I am simply looking for better ways to do it (possibly incorporating the fact that there are repeated measures) in order to reduce animal numbers and animal distress. In any case, thanks for the pointer to the joineR vignette. $\endgroup$
    – iayork
    Commented Apr 27, 2016 at 13:59
  • 1
    $\begingroup$ It wasn't clear to me from the question that you intended to look at daily weight changes. To clarify: on any day after the time that treatment starts leading to deaths, simply looking at weight change makes little biological or statistical sense. Up to that time you might proceed with partitioning, as @StatNoodle recommends. If the weight regain in animals that don't die begins after the deaths in other groups start, then comparisons of weight change alone among groups are meaningless. Beyond that time you absolutely must include probability of death in your model. $\endgroup$
    – EdM
    Commented Apr 27, 2016 at 14:12
  • $\begingroup$ I strongly disagree with the idea that looking at weight change doesn't make biological sense. I'm going to update the question, because I'm not sure it's clear what I'm asking. $\endgroup$
    – iayork
    Commented Apr 27, 2016 at 14:48

Your Answer

By clicking “Post Your Answer”, you agree to our terms of service and acknowledge you have read our privacy policy.

Not the answer you're looking for? Browse other questions tagged or ask your own question.