2
$\begingroup$

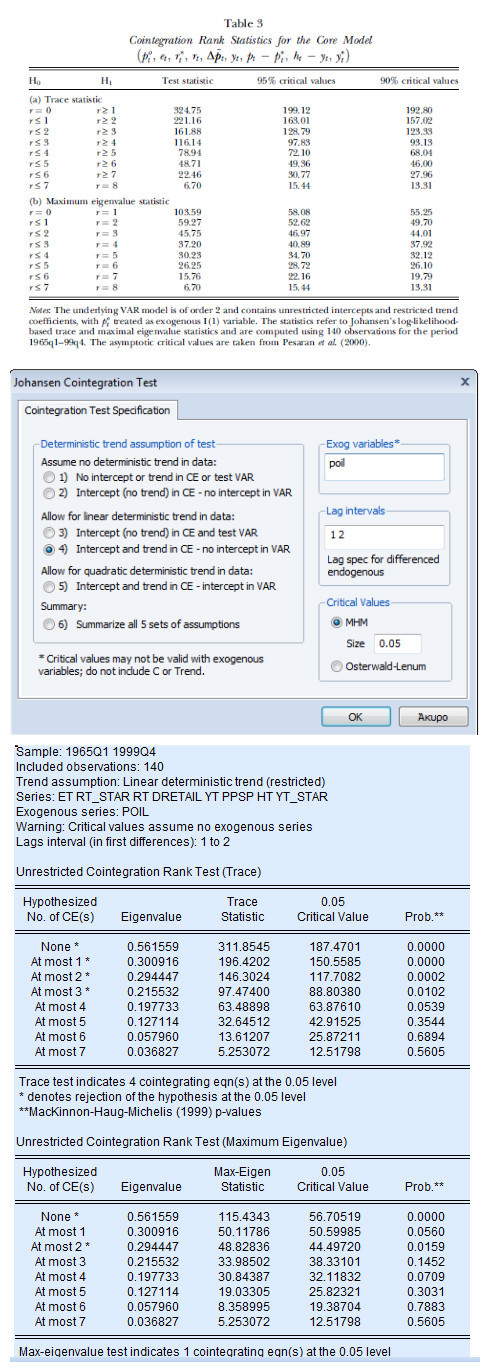
I am trying to replicate Tables 3 and 4 from the paper "A Long Run Structural Macroeconometric Model OF the UK" by Garratt et al (2003).

Using the Akaike criterion the authors decide to proceed with a VAR(2) model with unrestricted intercepts and restricted trend coefficients (this is option IV on the Eviews programme I reckon). The VAR consists of 9 variables, these are ($p_t^{oil}$, $e_t$, $r_t^*$, $r_t$, $\Delta Retail.price.index_t$, $y_t$, $p_t-p_t^*$, $h_t-y_t$, $y_t^*$) with $p_t^{oil}$ treated as an exogenous I(1) variable.

The authors found 5 and 2 cointegrating relationships using the Trace and Maximum Eigen Value tests respectively. They proceed assuming 5 cointegrating relationships. My findings suggest 4 cointegrating relationships for the former test and 1 for the latter. How can I replicate the author's findings?

The actual table 3 from Garratt et al. (2003) paper, my first step using Eviews and my conflicting results follow below.

Final photo

Please find to this link my incomplete EViews Programme.

$\endgroup$
3
  • $\begingroup$ Are you sure you have the exact same data? It also says that the underlying VAR has two lags. This means your VECM has one lag. You should write "1 1" for lags in Eviews. $\endgroup$
    – hejseb
    Commented Apr 20, 2016 at 5:03
  • $\begingroup$ I'm 100% positive I have the exact same data. $\endgroup$ Commented Apr 20, 2016 at 7:07
  • $\begingroup$ I added the study to the ReplicationWiki (that I founded) and noted your question on the discussion page. Hope this helps. $\endgroup$ Commented May 8, 2016 at 18:15

1 Answer 1

0
$\begingroup$

First of all, as hejseb already wrote, you have one lag too many in your specification, because Eviews --as it mentions in the dialog window-- refers to lags of "differenced endogenous" instead of the endogenous (levels) themselves. Correcting that should produce a match of the eigenvalue statistics (provided the exact same sample is used and the original table is actually correct).

If you also want to match the critical values, note that Eviews doesn't do it for exogenous variables (as is also mentioned in the spec window and in the output). The article uses critical values from: "Pesaran, M.H., Shin Y., Smith, R.J. (2000). Structural analysis of vector error correction models with exogenous I(1) variables. Journal of Econometrics 97:293-343.", at least it seems that way.

$\endgroup$

Your Answer

By clicking “Post Your Answer”, you agree to our terms of service and acknowledge you have read our privacy policy.

Not the answer you're looking for? Browse other questions tagged or ask your own question.