1
$\begingroup$

This has probably been asked before, but I couldn't find anything. I need to compare continuous variable in two groups: I can calculate mean, s.d., etc. I can do t-test. If t-test is statistically significant, how can I find the exact value, which separates one group from another? Like if x>100 we expect it to be in group A. Should I use 95% CI for this??

Basically I have a task like this: patients in group A have mean age of, say 35, with sd=5. Patients in group B have mean age of 50 with sd=6. T-test shows singificant difference between groups. Is there a way to find some age X, that we can use to state that patients above that age are more likely to belong to group B. Sorry, I must be terrible at explaining.

$\endgroup$
6
  • $\begingroup$ What do you mean by value "separating" the two groups? $\endgroup$
    – Tim
    Commented Aug 9, 2016 at 9:02
  • 2
    $\begingroup$ It's not entirely clear what you're asking. Do you mean that, e.g., the mean of group 1 is 50, the mean of group 2 is 150. If someone had a score of 75 then what is the probability that they'd be in group 1 (rather than group 2)? $\endgroup$
    – Ian_Fin
    Commented Aug 9, 2016 at 9:02
  • $\begingroup$ Is your question about finding the minimal difference that is statistically significant (given some $p$) when using t-test? If yes, please edit to clarify. $\endgroup$
    – Tim
    Commented Aug 9, 2016 at 9:22
  • $\begingroup$ Basically I have a task like this: patients in group A have mean age of, say 35, with sd=5. Patients in group B have mean age of 50 with sd=6. T-test shows singificant difference between groups. Is there a way to find some age X, that we can use to state that patients above that age are more likely to belong to group B. Sorry, I must be terrible at explaining. $\endgroup$ Commented Aug 9, 2016 at 9:54
  • 1
    $\begingroup$ So it seems that you are interested rather in classification then in hypothesis testing. $\endgroup$
    – Tim
    Commented Aug 9, 2016 at 10:42

2 Answers 2

2
$\begingroup$

This is a classification problem. If you want to find single value that marks the threshold that let's you to divide your data into two groups, then the most standard approach to problem as yours is to use decision tree. Decision tree algorithm splits your data into branches given the predictors such that the resulting split leads to most accurate classification.

Blow you can see usage of R's rpart function on some made-up data. It does exactly what you want: finds threshold value that let's you to classify the data into two groups. Of course, in more complicated cases the tree could have more levels and you'd need to prune it.

library(rpart)
set.seed(123)

n <- 50
x <- rnorm(n, 1)
y <- rnorm(n, 3)

dat <- data.frame(
  predictor = c(x,y),
  group = factor(rep(letters[1:2], each = 50))
)

(fit <- rpart(group ~ predictor, data = dat, method = "class")))
## n= 100 
## 
## node), split, n, loss, yval, (yprob)
##       * denotes terminal node
## 
## 1) root 100 50 1 (0.50000000 0.50000000)  
##   2) predictor< 1.911667 46  3 a (0.93478261 0.06521739) *
##   3) predictor>=1.911667 54  7 b (0.12962963 0.87037037) *

On the plot below you can see distributions of both variables with marked decision threshold.
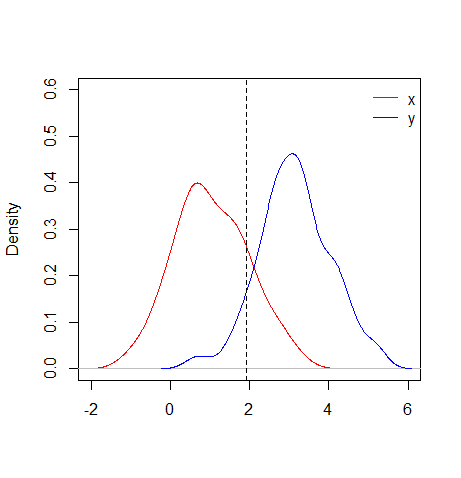
Distributions of both variables with decision threshold value

Notice that this is something different then hypothesis testing. In case of using hypothesis test such as $t$-test you ask yourself if means of both groups significantly differ. In case of classification you do not care if there is any difference at all, just look for the best model that minimizes some loss function (even though is can be a really poor model in some cases).

$\endgroup$
2
  • $\begingroup$ I think this is a good answer but since the OP seemed particularly keen to also be able to test for differences, within the decision tree approach is there any way to see whether the means of the two groups differ? Or would this have to be done with an additional t-test (or similar)? $\endgroup$
    – Ian_Fin
    Commented Aug 9, 2016 at 13:04
  • 1
    $\begingroup$ @Ian_Fin it wouldn't make sense. In t-test you compare the actual groups. In classification you classify to "most likely" groups given the model. Moreover, the means are not related to the decision tree (it can even make non-linear classifications e.g. a > x > b or x > c). $\endgroup$
    – Tim
    Commented Aug 9, 2016 at 14:26
0
$\begingroup$

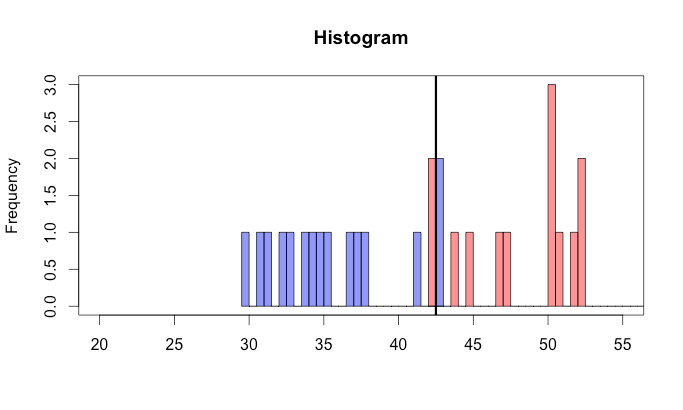
If your sample sizes are about equal, then one possible solution is simply to find the value(s) that separate your two groups such that there is the least amount of overlap in your existing data, and use this as your threshold. For example: enter image description here

$\endgroup$
5
  • $\begingroup$ How would you operationalise the least amount of overlap? If there was no overlap between the two groups then what would you set as the threshold? $\endgroup$
    – Ian_Fin
    Commented Aug 9, 2016 at 13:08
  • $\begingroup$ If there is no overlap, then this is the best-case scenario. In this case, I would recommend using the midpoint between the highest value of the lower group and the lowest value of the higher group $\endgroup$
    – David C
    Commented Aug 9, 2016 at 13:11
  • $\begingroup$ Would this still make sense if there was unequal variance? I haven't thought this through fully, but an observation sitting right on the midpoint of two non-overlapping groups with unequal variance would seem more likely to come from the group with greater variance (because it would be fewer standard deviations from the mean of that group) $\endgroup$
    – Ian_Fin
    Commented Aug 9, 2016 at 13:14
  • $\begingroup$ The variables are continuous, so the probability of any given sampled value being exactly equal to the midpoint is zero $\endgroup$
    – David C
    Commented Aug 9, 2016 at 13:16
  • $\begingroup$ True, but if we change "right on the midpoint" to "quite near the midpoint" I'm not sure that my concern doesn't stand. $\endgroup$
    – Ian_Fin
    Commented Aug 9, 2016 at 13:31

Your Answer

By clicking “Post Your Answer”, you agree to our terms of service and acknowledge you have read our privacy policy.

Not the answer you're looking for? Browse other questions tagged or ask your own question.