We have two publications in this domain, but I am not entirely convinced in the approaches. But you should have a look.
In the publication below, we explored a circular layout to visualize the overlap of clusters. You could click segments to see them colored in a scatterplot (but of course scatterplots do not scale to high-dimensional data).
This allows to see how clusters related to each other.

The circular layout is beneficial, because the complexity of the visualization is higher on the outer circle, where we have more space. A "linear" display is less readable. The size of the segments is based on pairs like many of the evaluation indexes (e.g. ARI). In above image, the red and yellow clusters are one cluster in the outer area, which causes additional pairs (the bottom segment, which does not exist in the inner circle - because these are two pairs there, they do not "pair"). Understanding how the "pairs" work is pretty non-intuitive, sorry.
This approach can use more than two clusterings, but usually at three clusterings it already becomes rather incomprehensible.
E. Achtert, S. Goldhofer, H.-P. Kriegel, E. Schubert, A. Zimek
Evaluation of Clusterings – Metrics and Visual Support
In Proceedings of the 28th International Conference on Data Engineering (ICDE), Washington, DC: 1285–1288, 2012.
The code in ELKI is expected to work, but I have not verified this in a looong time.
The second reference I can suggest is this:
E. Schubert, A. Koos, T. Emrich, A. Züfle, K. A. Schmid, A. Zimek
A Framework for Clustering Uncertain Data
Proceedings of the VLDB Endowment, 8(12): 1976–1979, 2015.
While this is titled "Clustering Uncertain Data", it is very closely connected to alternative clustering. Because uncertain data can be clustered by looking at alternatives obtained when taking "certain" samples from the uncertain data, and then running a traditional clustering algorithm.

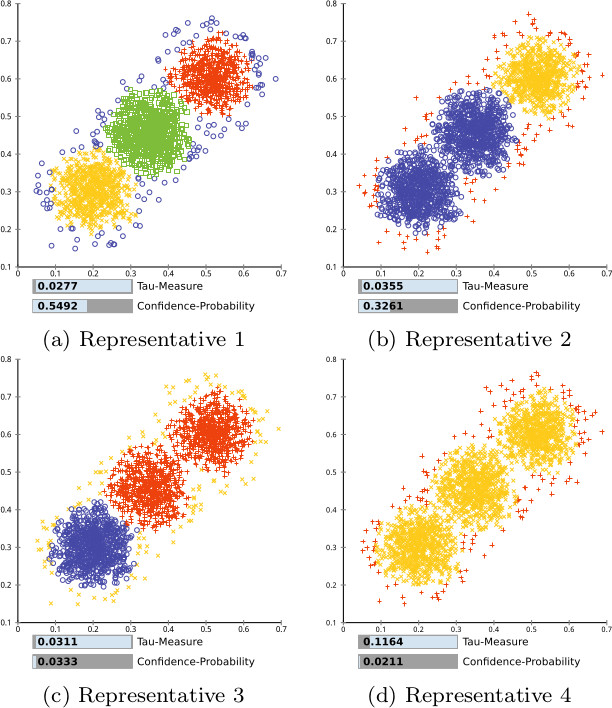
The tau value shows how similar the clusterings in each cluster are. The confidence probability is an estimate how many clustering results will look similar to the representative. The numbers may not add up to 1 - in this screenshot, we expect some 7% of clusterings to be dissimilar from the examples that we show here.
With uncertain data, you need to look at many samples. But then you have 50-100 (or even many more) clusterings. Thus, we cluster clusterings based on their similarity, to get some representative clusterings the user can then explore. Again, this functionality is available in ELKI, but you need to set some 30-40 parameters to reproduce these results (there is no "standard format" for uncertain data, many of these parameters are to specify the uncertainty that is associated with the data points).
Details on representative clusterings are here:
A. Züfle, T. Emrich, K. A. Schmid, N. Mamoulis, A. Zimek, M. Renz
Representative Clustering of Uncertain Data
In Proceedings of the 20th ACM International Conference on Knowledge Discovery and Data Mining (SIGKDD), New York, NY: 243–252, 2014.


