9
$\begingroup$

We often study Gaussian Mixture model as a useful model in machine learning and its applications.

What is the physical significance of this "Mixture"?

Is it used because a Gaussian Mixture Model models the probability of a number of random variables each with its own value of mean? If not, then what is the correct interpretation of this word.

$\endgroup$

3 Answers 3

12
$\begingroup$

A distribution combines different component distributions with weights that typically sum to one (or can be renormalized). A is the special case where the components are Gaussians.

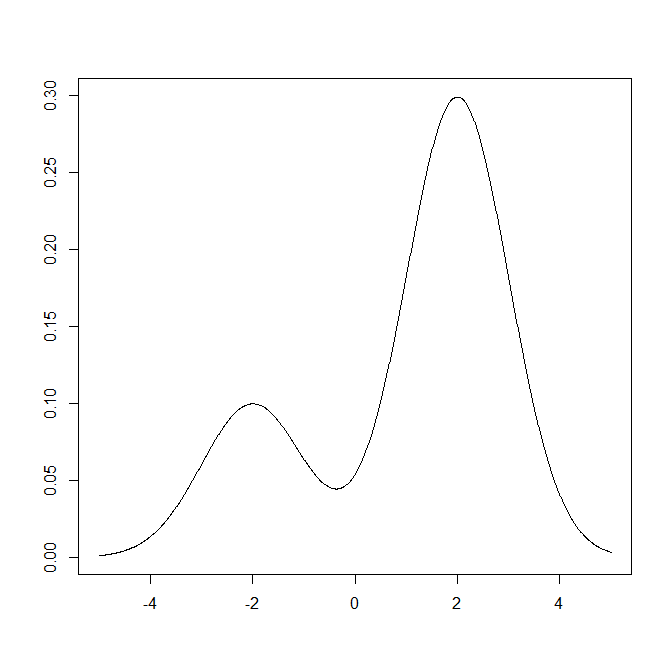
For instance, here is a mixture of 25% $N(-2,1)$ and 75% $N(2,1)$, which you could call "one part $N(-2,1)$ and three parts $N(2,1)$":

xx <- seq(-5,5,by=.01)
plot(xx,0.25*dnorm(xx,-2,1)+0.75*dnorm(xx,2,1),type="l",xlab="",ylab="")

mixture

Essentially, it's like a recipe. Play around a little with the weights, the means and the variances to see what happens, or look at the two tags on CV.

$\endgroup$
0
8
$\begingroup$

Yes a Gaussian Mixture is called this way because it is assumed that the observed data come from a Gaussian mixture distribution which consists of $K$ Gaussians with their own means and variances. However, the $K$ classes are latent and so is the indicator telling you which class an observations belongs to.

The goal of mixture modeling is now to estimate the most likely class for each observation. Therefore, Gaussian mixture modeling can be viewed as a missing data problem. Estimation is usually done using the EM algorithm.

$\endgroup$
2
  • $\begingroup$ can I assume that the K gaussians are related to one another (through weights such that their sum equals to one) $\endgroup$
    – Upendra01
    Commented Sep 22, 2016 at 10:35
  • $\begingroup$ @Snowbell Yes, usually it is assumed that the weights are normalized in the sense that they sum to 1. For general information about mixtures you might want to check en.wikipedia.org/wiki/Mixture_distribution $\endgroup$
    – tomka
    Commented Sep 22, 2016 at 11:41
2
$\begingroup$

Suppose a factory makes widgets, initially of one particular size. Its output might be described by a Gaussian distribution, where the mean represents the desired size of the item and the variance comes from well...variance in the manufacturing process (differences in operators' skill, impurities, etc).

During the next shift, the factory starts producing widgets of a different size. These products could also be described by a Gaussian with a new mean, the new size, and potentially a different variance (maybe smaller items are harder to make).

A Gaussian Mixture Model describes the combined output from all shifts, as if they were literally mixed together. It consists of a set of Gaussians, each with their own mean and variance, as well as weights denoting the contribution of each and a normalization constant that ensure the whole things sums to one. The "generative story" is that each item is produced by choosing a first choosing a Gaussian according to its weight, then drawing a sample from that particular Gaussian.

In practice, we often want to run this process in reverse. We assume that the samples were generated by a finite, fixed number of Gaussians, and via the E-M algorithm, recover the parameters of those Gaussians and the "mixing" weights. Armed with that, we can then find the most likely "generator" for each example. For example, we might know that the factory two sizes of items. Fitting a mixture model could tell us that the small size is 1L (with a variance of 0.1) vs the large's 3 ± 0.3L. Moreover, we could determine whether a particular item, measured at 2L is more likely to have come from the "small" or "large" batches.

$\endgroup$

Your Answer

By clicking “Post Your Answer”, you agree to our terms of service and acknowledge you have read our privacy policy.