6
$\begingroup$

I have calculated the correlation between A and B for 10 different subjects. For averaging purposes, I've converted the r-values to z-values using Fisher's z-transformation.

subj zvalue
s1 -0.04
s2 -0.14
s3 -0.29
s4 -0.20
s5 -0.37
s6 -0.01
s7 -0.09
s8  0.20
s9 -0.15
s10  0.09

I want to test if the correlation between A and B is significantly different from zero. Do I use a paired sample t-test against 0 with the z-values, then report the r-value converted from the mean z-value? Or should I convert each subject's z-value back to an r-value before doing the t-test?

Edit: Critically, is a paired t-test against 0 appropriate to test if this correlation is significant across subjects?

$\endgroup$

4 Answers 4

7
$\begingroup$

Treat r (or Z) as any effect size and calculate its mean using a standard formula:

$\bar{r} = \Sigma r_iw_i$/$\Sigma w_i$

where $r_i$ is the $i$th value of r and $w_i$ is a weighting factor which is $1/s^2(r_i)$

The standard error of $\bar{r}$ is given by the square root of $1/\Sigma w_i$ and you can use this to construct confidence intervals around $\bar{r}$ and check whether they include 0 or not.

$\endgroup$
2
  • $\begingroup$ What's the justification for weighting the r values? $\endgroup$
    – Amyunimus
    Commented Apr 26, 2012 at 21:30
  • 1
    $\begingroup$ @Amyunimus: it gives greater weight to values with smaller variance/higher n, which are assumed to more closely estimate the "true" value. $\endgroup$ Commented Apr 27, 2012 at 10:05
3
$\begingroup$

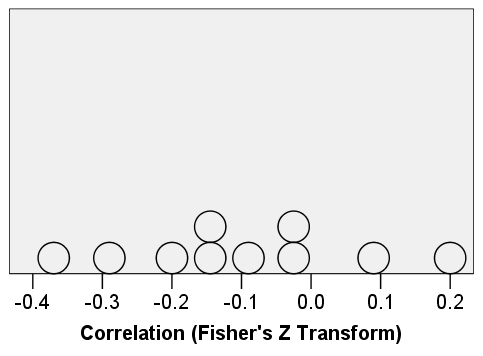
I can relate to the way you're thinking about it, and of your 2 ideas, I'd say the first is clearly preferable: Fisher designed Z such that any computations such as averaging are better done with Z than with the (0, 1)-bounded r. But in this situation a sig. test seems less helpful, and its results would be less clear, than in the usual case. If there is one. For one thing, we wouldn't have taken into account how many values went into each subject's r, so it'd take some thinking to figure out the best df for the test. Have you considered simply showing the results and letting people make up their mind that way? E.g., in a dot plot:

enter image description here

Edit: perhaps better would be a bubble plot in which bubble size represented the N that went into each correlation.

$\endgroup$
2
$\begingroup$

I think the first approach is preferable (reporting Z values only). Converting the Z values back to r before the test wouldn't really do anything (it would be as if you had never transformed in the first place).

But you may have noticed that in your data it makes very little difference whether you use Z or r since the nonlinearities of the Fisher transform only really enter for r>0.5 1 and your Z values imply smaller correlations than that. I would emphasise this point when reporting the analysis.

$\endgroup$
2
$\begingroup$

The r-values should be Fisher's z-transformed, then compared to zero using a one-sample t-test, not a paired-sample t-test.

$\endgroup$

Your Answer

By clicking “Post Your Answer”, you agree to our terms of service and acknowledge you have read our privacy policy.

Not the answer you're looking for? Browse other questions tagged or ask your own question.