2
$\begingroup$

I am tuning alpha coefficient in Lasso regularisation to get best result on cross-validation:

alphas = np.arange(1,200, 1)
from sklearn.linear_model import LassoCV
lasso=LassoCV(alphas=alphas)
r=lasso.fit(X,y)
plt.plot(alphas,lasso.mse_path_)

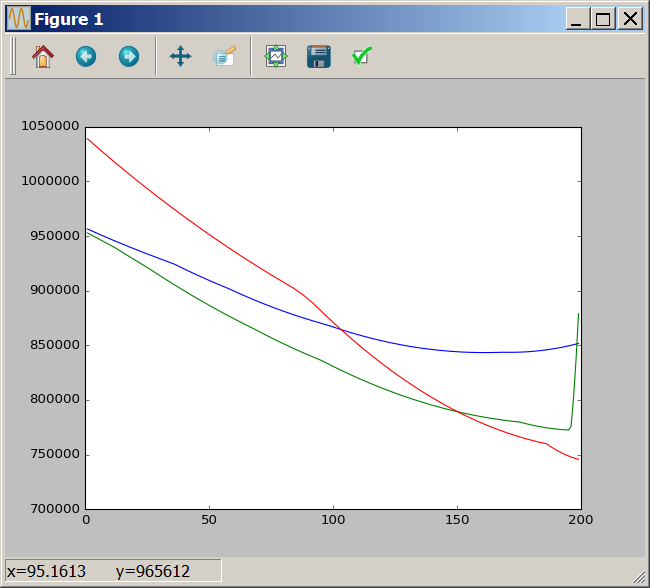
This gives me following picture:

enter image description here

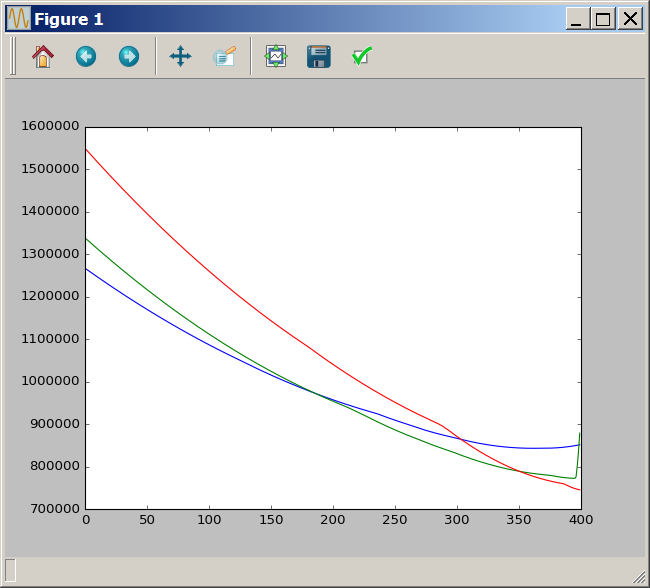
I want to see minimum of the red curve,enlarge alpha interval twice (np.arange(1,400, 1)) and rerun the code:

enter image description here

Why curves' coorientations depend on alphas array size??

$\endgroup$

1 Answer 1

1
$\begingroup$

You should use sklearn.linear_model.LassoCV.alphas_ for the $X$ axis.

Your plot

plt.plot(alphas,lasso.mse_path_)

implicitly assumes the order is the original one of alphas. This is a logical assumption, but it happens to be incorrect - in your case, it's outputting results corresponding to a reverse order of your alphas. If you use

plt.plot(lasso.alphas_, lasso.mse_path_)

your plots will do what you want.

$\endgroup$

Your Answer

By clicking “Post Your Answer”, you agree to our terms of service and acknowledge you have read our privacy policy.

Not the answer you're looking for? Browse other questions tagged or ask your own question.