With binary variables and all interactions present, you can't have lack of fit against those variance (here I mean lack of fit in the mean-function) so there's no point looking for any.
Consider a single binary (0/1) variable to simplify things. The fit goes through the mean of the 0 group and the mean of the 1 group and those are the only places you ever get values on those variables. It's always perfectly fitted by a straight line.
The reasonableness of the assumption of equality of variance is assessed in the usual way -- does the spread change appreciably at different combinations of the predictors? Often we're specifically interested in spotting spread that changes with the mean, which is the kind we can most easily detect with a plot against fitted values.
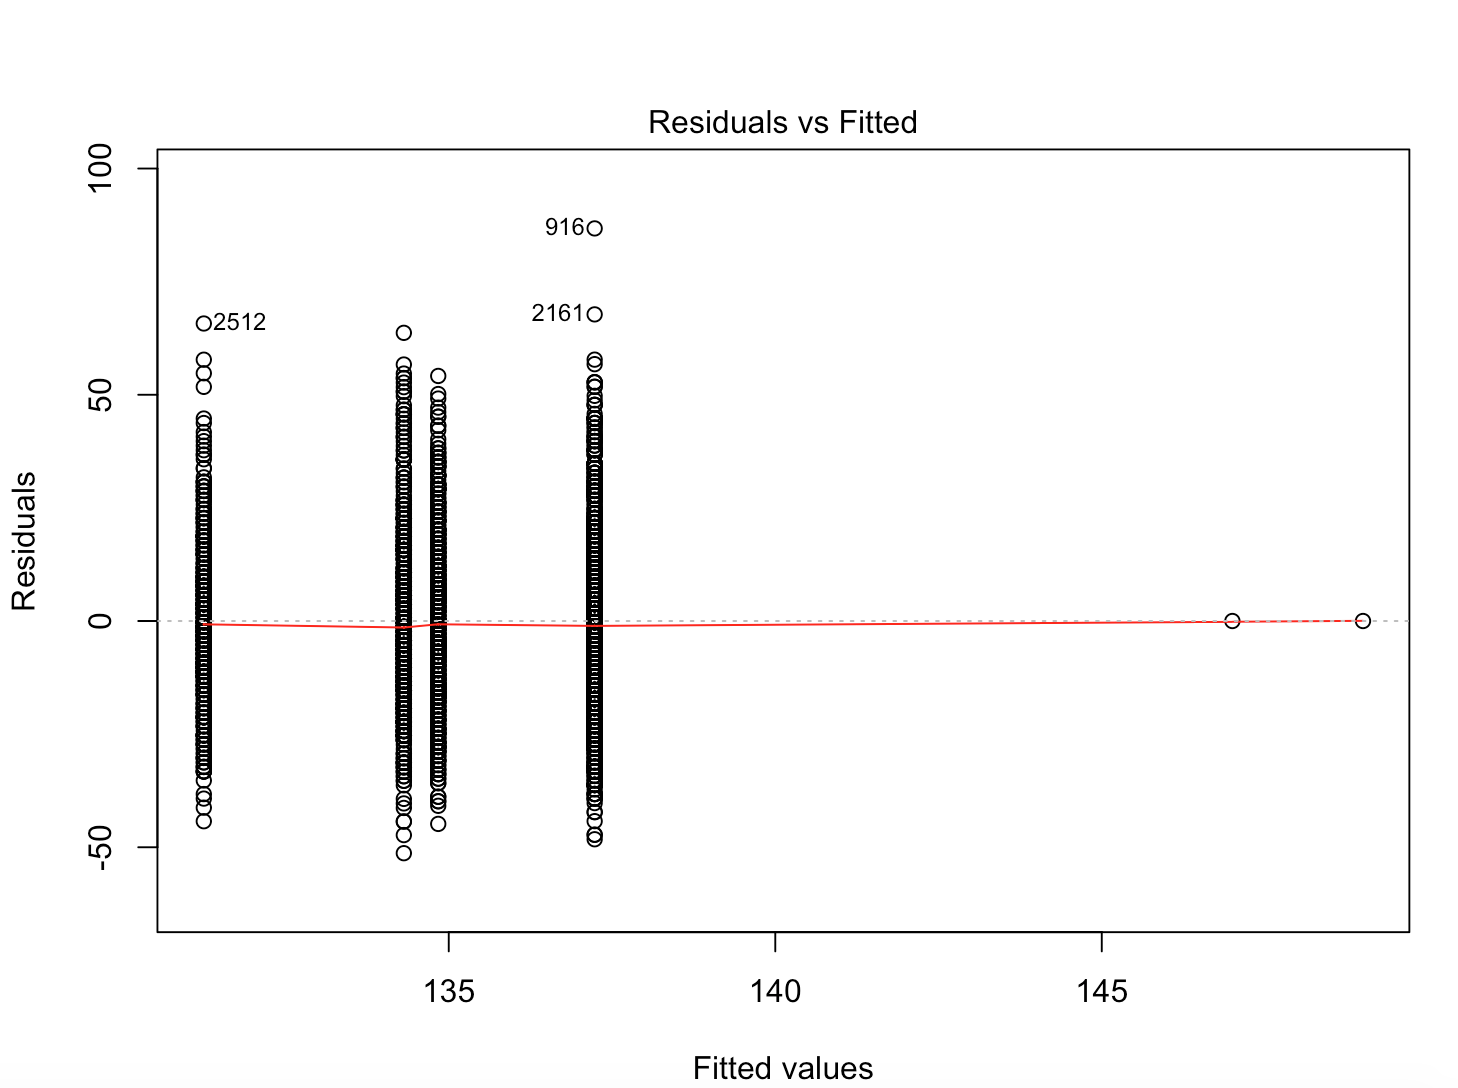
With factors the residuals will be clumped into vertical "lines" but you can compare their spread easily enough.
However, the plot indicates a serious problem - your description of your variables must be flat out wrong.
You have SIX different fitted values in that plot. At least one of your variables is NOT binary.
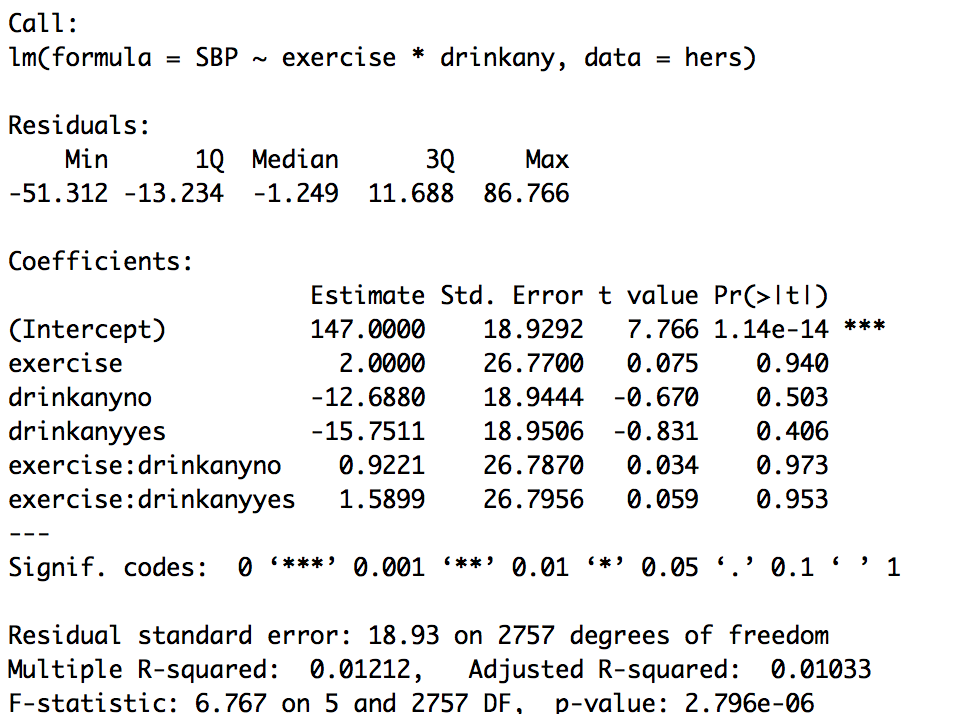
The output from the fit of the linear model confirms it. drinkany has coefficients for two levels... which means that there's a third level that is being used as the reference level.
Do a summary or a tabulation of hers$drinkany to see the three levels. Then figure out if you needed to remove some values or whether drinkany is not supposed to be binary and fix your question and output.


drinkanyis yes/no, how come both are listed in your output? Can you paste inhead(hers)? Can you paste in your code? (Also, just copy & paste, don't take a screenshot & upload that.) $\endgroup$