17
$\begingroup$

How to calculate R-squared ($r^2$) statistic in R for loess and/or predict function output? For example for this data:

cars.lo <- loess(dist ~ speed, cars)
cars.lp <- predict(cars.lo, data.frame(speed = seq(5, 30, 1)), se = TRUE)

cars.lp has two arrays fit for model and se.fit for standard error.

$\endgroup$
1
  • $\begingroup$ In linear regression $R^2$ is equal to the squared correlation between the observed values and the fitted values - how about that? $\endgroup$
    – Macro
    Commented Mar 22, 2012 at 1:12

1 Answer 1

12
$\begingroup$

My first thought was to compute a pseudo $R^2$ measure as follows:

ss.dist <- sum(scale(cars$dist, scale=FALSE)^2)
ss.resid <- sum(resid(cars.lo)^2)
1-ss.resid/ss.dist

Here, we get a value of 0.6814984 ($\approx$ cor(cars$dist, predict(cars.lo))^2), close to what would be obtained from a GAM:

library(mgcv)
summary(gam(dist ~ speed, data=cars))

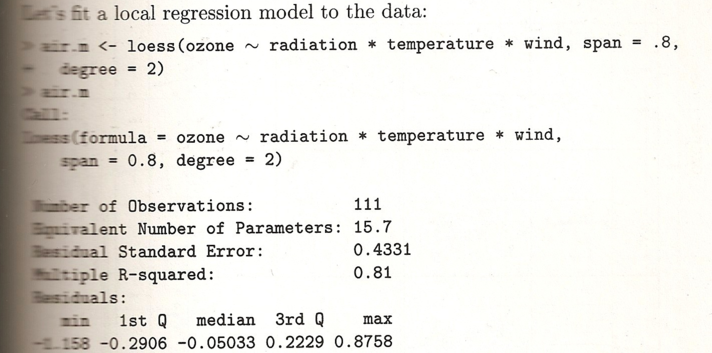
This also seems to be in agreement with what S loess function would return (I don't have S so I can't check by myself) as Multiple R-squared. For example, using the airquality R dataset, which looks like the air data Chambers and Hastie used in the 'white book' (the one that is being referenced in the on-line help for loess; but that's not the exact same dataset), I got an $R^2$ of 0.8101377 using the above formula. That's pretty in agreement with what Chambers and Hastie reported.
enter image description here

I should note that I didn't find any paper dealing specifically with that (ok, that was just a quick googling), and William Cleveland doesn't speak about $R^2$-like measure in his paper.

However, I wonder if the liberty with which you can choose the degree of smoothing (or window span) does not preclude any use of $R^2$-based measure.

$\endgroup$
4
  • 10
    $\begingroup$ Your last line is correct: computing a pseudo-$R^2$ is contrary to the spirit of Loess, which is to explore, identify patterns, and smooth data. Computing a measure like this misses the point and, IMHO, is an abuse of the tool. Instead, if you want to assess the fit, continue in the spirit of EDA and analyze the residuals (the "rough" in Tukey's language). Although you might wind up looking at m-letter statistics, IQRs, etc., which could be construed as serving in a role a bit like $R^2$, the analysis proceeds in an entirely different spirit. $\endgroup$
    – whuber
    Commented Mar 22, 2012 at 3:24
  • $\begingroup$ @whuber: So it will be better (more accurate) to use polynominal (or other) model with $r^2$ supported when to use loess model if I need to get how good resulting model describes source data? $\endgroup$ Commented Mar 22, 2012 at 6:11
  • 4
    $\begingroup$ Not necessarily "more accurate." Indeed, using Loess to achieve accuracy in a predictive model would be foolhardy. I think referring to Loess as a "model" conveys a possible misunderstanding about how it works and how it is intended to be used: it is really a graphical, exploratory tool to help see patterns and trends. Because it is really just a moving-window smoother, it acts as a fairly complicated spatial neighborhood model in which the fitted value at a point depends on which neighboring points exist in the dataset and on the values there. $\endgroup$
    – whuber
    Commented Mar 22, 2012 at 14:06
  • 2
    $\begingroup$ Would it be more conceptually sound to calculate the $ r^2$ from a GAM? $\endgroup$ Commented Sep 16, 2014 at 10:41

Your Answer

By clicking “Post Your Answer”, you agree to our terms of service and acknowledge you have read our privacy policy.

Not the answer you're looking for? Browse other questions tagged or ask your own question.