4
$\begingroup$

My data:

df=structure(list(A = c(33.9166666666667, 5.16666666666667, 29.9166666666667
), B = c(12.6666666666667, 3.16666666666667, 20.6666666666667
), D = c(106.416666666667, 26.1666666666667, 196.416666666667
)), .Names = c("A", "B", "D"), class = "data.frame", row.names = c(NA, 
3L))

People will buy two products and for each product for one or several reasons. For product 1 (reason=1,2,3) and product 2 (reason=A,B,D) and the reasons could be combinated. I obtained this table by ponderate the reasons, gives it weight and make addition finally of all matrix. My aims was to explore if there is association between resaons, so I used CA.

I used the following R code :

#install.packages("FactoMineR")
library(FactoMineR)
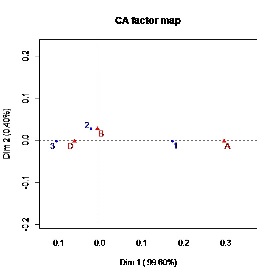
CA(df)

enter image description here

My interpretations of the AFC : 1- The first Axis oppose modalities 3 and 1, and the modalities D and A. 2- Customer who buy product 1 for the reason 3 tends to buy product 2 for the reason D. 3- Customer who buy product 2 for the reason 1 tends to buy product 2 for the reason A.

Now what is strange is when I execute a chisq.test(df), I'm failing to reject the null hypothesis (Reasons of buying 1,2,3 are independent from Reasons of buying A,B,D)

     Pearson's Chi-squared test
data:  df
X-squared = 7.3028, df = 4, p-value = 0.1207

While it is clear in the AFC that the reasons are not independant, why I don't have significant result of p-value on chi-square ? What is the problem in my analyses ?

$\endgroup$

1 Answer 1

3
$\begingroup$

I see at least two problems with your approach: the data, and your interpretation of the correspondence analysis plot.

First, you shouldn't use a chi-square test like that with weighted data (NB: I assume that by "ponderating" you mean "applying weights"). It is unclear where the weights you used are coming from. You should provide more information about them -or better, ask a specific question about the validity of what you did exactly. For example, if they are some survey weights, a Rao-Scott chi-square test may be more appropriate than a "vanilla" chi-squared test. See also Can chi-square test be used on non-integer observed frequencies?

Secondly, the plot describes the sample, not the population. So you can't draw conclusions about the population just from it. Incidentally, when you run the line CA(df), the FactoMineR package throws a message saying that the chi-squared test has a p-value of 0.12, certainly to remind you to interpret the plot with caution. So no contradiction here.

Correspondence analysis is chiefly a descriptive technique, not an inferential one (even though some extensions like confidence ellipses may allow some inference -yet I'm not sure how correspondence analysis and associated confidence ellipses would work with survey weights, or if it would even make sense).

$\endgroup$
0

Your Answer

By clicking “Post Your Answer”, you agree to our terms of service and acknowledge you have read our privacy policy.

Not the answer you're looking for? Browse other questions tagged or ask your own question.