8
$\begingroup$

I have come across a somewhat unusual (I think) estimation problem. I have two "coupled" linear regression models, $$Y = a + b x + \epsilon, \quad Z = c + d x + \nu$$ where $Y,Z,\epsilon,\nu$ are random variables and $a,b,c,d$ are sought parameters. The twist is that the common independent variable $x$ is unobservable; I only have a number of paired observations $$(y_1, z_1), (y_2, z_2), \dots (y_n, z_n) \ .$$ So $y_i, z_i$ originate from the same $x_i$ according to the linear models, but the $x_i$ is not available. If we just consider the regression lines $y = a + b x$ and $z = c + d x$, eliminating $x$ yields $$ \frac{1}{b}(y-a) = \frac{1}{d}(z-c) $$ which I suppose could be solved by regression. It's clear that not all parameters can be estimated from this, but I would guess that the ratio $b/d$ and perhaps the difference $a-c$ might be suitable parameters.

My question is: what can be estimated in this situation, and is there some well-known model? What form of parameters is most tractable, are small-sample distributions of estimators known (under normality assumptions, for example), etc. Is this perhaps a special case of some hidden variable method?

In my scenario, $x_i, y_i$ and $z_i$ are all nonnegative (just to complicate things ...) but I would be interested in any information on this problem, on the unconstrained case as well.

$\endgroup$
4
  • $\begingroup$ One additional problem is that this is bivariate; not an OLS problem, more like a Deming regression problem. $\endgroup$
    – Carl
    Commented Dec 18, 2016 at 19:05
  • $\begingroup$ @Carl, yes, that's true. $\endgroup$
    – Roland
    Commented Dec 18, 2016 at 19:11
  • $\begingroup$ Might want to check Errors in Variables problems. In that setting you can estimate $x$ $a$ and $b$. $\endgroup$
    – Manuel
    Commented Jan 28, 2019 at 15:42
  • $\begingroup$ All methods come down to PCA on the observations. $\endgroup$
    – whuber
    Commented Jul 3, 2022 at 19:38

2 Answers 2

0
$\begingroup$

You already have this: $$ \quad \frac{1}{b} (y - a) = \frac{1}{d}(z - c) $$

So let's go one step further and solve it for $y$:

$$ \quad y = \frac{b}{d}(z - c) - a = \frac{b}{d} \cdot z - \frac{b}{d} \cdot c + a $$

This means you can find $(a - \frac{b}{d}\cdot c)$ and the ratio $b/d$ by regressing $y$ on $z$. Similarly if you regress $z$ on $y$ you can find $(c - \frac{d}{b} \cdot a)$ and the ratio $d/b$. Unfortunately you cannot infer anything about $a$ and $c$ because the two equations $a - \frac{b}{d}\cdot c$ and $c - \frac{d}{b} \cdot a$ are essentially equivalent (so you have one equation with two unknown parameters). You can also not tell what the value of $x$ is because even though you may know the ratio $b/d$ (or its inverse), there are infinitely many values for $b$ and $d$ that can satisfy that ratio.

$\endgroup$
5
  • $\begingroup$ Yes, the quantities b/d and a - bc/d are easy to get. But that doesn't allow solving for a and c, as far as I can tell --- how would you do that? Fundamentally, only two independent parameters obtainable from a regression line, and a,c seem tangled up with the ratio b/d somehow. $\endgroup$
    – Roland
    Commented Dec 19, 2016 at 17:01
  • $\begingroup$ ah yes you are right, you can't find $a$ and $c$ because you essentially end up with two different representations of one equation, and the two unknown parameters $a$ and $c$. $\endgroup$
    – Radix
    Commented Dec 19, 2016 at 17:52
  • $\begingroup$ There is still some information about a,c in the problem -- essentially, the point estimate is a line in the (a,c) plane. The linear algebra is not hard, but the question is if this situation is understood as a statistical model. What parameterization is most tractable, are small sample distributions of estimators known, etc. $\endgroup$
    – Roland
    Commented Dec 20, 2016 at 7:58
  • $\begingroup$ I don't think you can come up with a model for this. Let's say $b/d = \tau$ and $a - \tau \cdot c = \gamma$. The parameters $a$ and $c$ could be anywhere on the line $a - \tau \cdot c = \gamma$. Similarly, for $b$ and $d$, they can be anywhere on the line $b = \tau \cdot d$. Unless you have some additional information about at least one of these 4 parameters, all solutions are equiprobable. $\endgroup$
    – Radix
    Commented Dec 20, 2016 at 14:32
  • $\begingroup$ Sorry, I'm not making myself clear. I certainly agree that it's impossible to estimate all parmeters a,b,c,d directly. I'm asking if there is anything known about estimation of the parameters that are uniquely obtainable. For example, if you have priors on b and d, how should we update them to a posterior given the data y, z. (I'm experimenting with this but wondering if anything similar has been done.) $\endgroup$
    – Roland
    Commented Dec 20, 2016 at 17:03
0
$\begingroup$

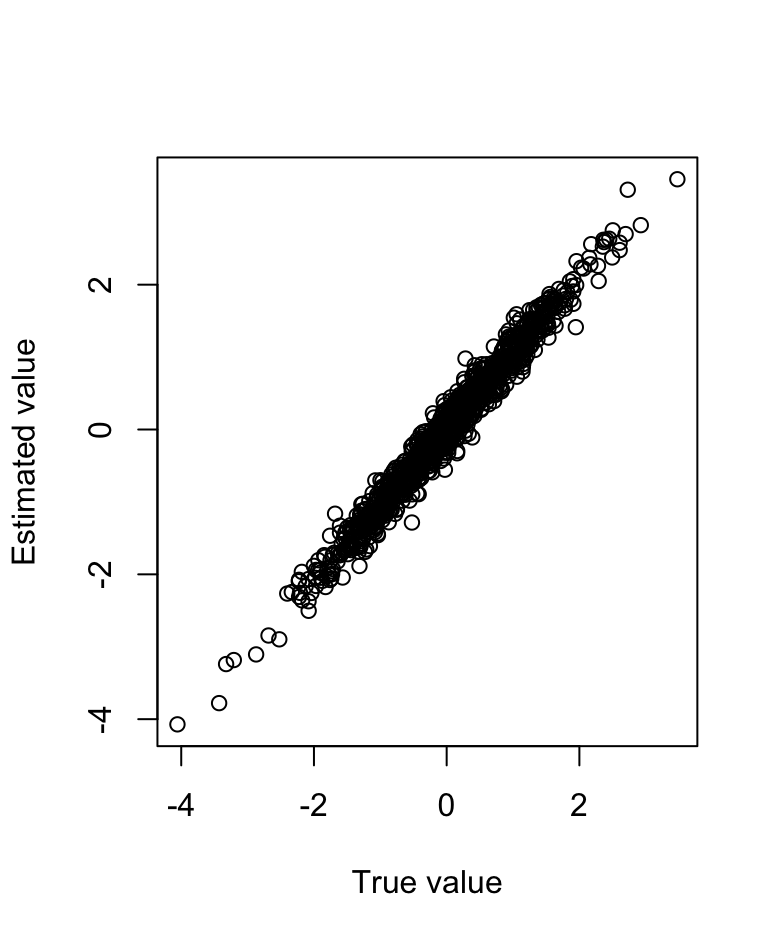
This is an old question, but when it popped up in the timeline I thought it would be a nice example of working with latent variables using Bayesian inference in stan:

library(rstan)
library(tidyverse)
a1 = 5
a2 = 10
b1 = 2
b2 = 3
e1 = .5
e2 = .7
n = 1000

x = rnorm(n)
y1 = a1 + b1 * x + rnorm(n, 0, e1)
y2 = a2 + b2 * x + rnorm(n, 0, e2)
data = data.frame(y1, y2)

code = '
data {
  int n;
  real y1[n];
  real y2[n];
}
parameters {
  real a1;
  real a2;
  real<lower=0> b1; // Make slopes positive
  real<lower=0> b2;
  real<lower=0> e1;
  real<lower=0> e2;
  real x[n];
}
model{
  x ~ normal(0, 1); // Enforce a distribution on x
  for(i in 1:n){
    y1[i] ~ normal(a1 + x[i]*b1, e1);
    y2[i] ~ normal(a2 + x[i]*b2, e2);
  }
}
'
stan_data = list(
  n = n, y1 = y1, y2 = y2
)
model = stan_model(model_code = code)
approx_model = vb(model, data = stan_data)
# Quick result using variational bayes
summary(approx_model, pars = c('a1', 'a2', 'b1', 'b2', 'e1', 'e2'))$summary %>%
  round(digits = 2)
##  mean se_mean   sd 2.5%  25%  50%   75% 97.5% n_eff khat
## a1 5.00     NaN 0.02 4.96 4.99 5.00  5.02  5.04   NaN 3.98
## a2 9.99     NaN 0.03 9.93 9.97 9.99 10.01 10.06   NaN 3.99
## b1 1.82     NaN 0.02 1.78 1.81 1.82  1.83  1.85   NaN 3.99
## b2 2.72     NaN 0.03 2.67 2.71 2.73  2.74  2.78   NaN 3.99
## e1 0.51     NaN 0.01 0.49 0.50 0.51  0.52  0.53   NaN 3.99
## e2 0.77     NaN 0.02 0.73 0.76 0.77  0.78  0.80   NaN 3.98

# More precise, slower result using MCMC
# mcmc_model = sampling(model, data = stan_data, chains = 2, cores = 2)
# summary(mcmc_model, pars = c('a1', 'a2', 'b1', 'b2', 'e1', 'e2'))$summary

# Estimated values of x
xhat = summary(approx_model)$summary %>%
  data.frame() %>% rownames_to_column('parameter') %>%
  filter(str_detect(parameter, 'x'))
plot(x, xhat$mean, xlab = 'True value', ylab = 'Estimated value')

enter image description here

$\endgroup$

Your Answer

By clicking “Post Your Answer”, you agree to our terms of service and acknowledge you have read our privacy policy.

Not the answer you're looking for? Browse other questions tagged or ask your own question.