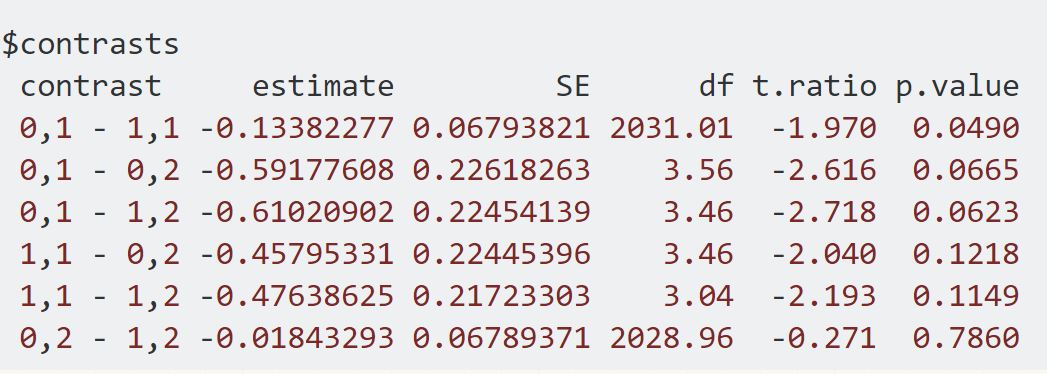
I am having problems to interpret the output of lme on my model. Here is the model;
model2 <- lme(Kfs~Density+Treat+Year, data=inf, random=~1|SiteNo/Plot, na.action=na.omit).
Kfs is Field- saturated hydraulic connectivity and Density is Bulk Density and these values measured $2$ times in $2$ years, so they are repeated measurements. These were measured on $5$ or $6$ different treatment types, so Treat means Treatments. I had $3$ different sites and many plots in each site. I used plot and sites as random part because we did not know where to make these measurements, so they were randomly selected.
Here is another question, Does R recognize the repeated measurements from the model or should I need to add more things?
I also added the output of the model to get help interpreting it.
Can you give me more details because they look all have different intercept and the slope? My purpose is to understand what is the statistical difference between Treat types especially between L, LSC, and MP.
I looked at some more details and I found how they make R recognize the repeated measurements. Here is the new code; see the new outputs

Output of lme from the last model.
This is output lsmeans. I want to interpret this but There is no p-value, I need help how to add P-value and I also gave an example that is what I want to get from output lsmeans.
That is what I want to get if it is possible to get from lsmeans.
