2
$\begingroup$

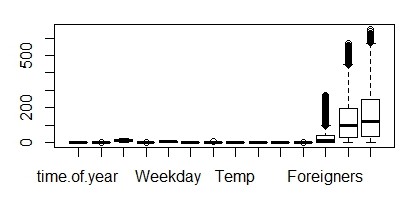
Here is the boxplot of whole data:

enter image description here

The data is about predicting the number of visitors (Locals, Foreigners, Total visitors, i.e Locals + Foreigners) in national park given certain parameters like temp, weekday etc.

There are some outliers in the dependent variables (last 3 variables in the plot). Although I have dealt with outliers in independent variables using different measures like removing them, replacing with central tendencies or using knn imputations but I have absolutely no idea how to deal with outliers in dependent variables.

Also, which model will be suitable with a data having both numerical and categorical independent variables and continuous dependent variable? I have tried random forest/decision trees and some regression techniques.

$\endgroup$
3
  • 3
    $\begingroup$ The main problem with an "outlier" in you dependent variable is that it might be an influential value. However, the first step is actually fitting a model. You can then investigate the impact such "outliers" have on the model. $\endgroup$
    – Roland
    Commented Feb 12, 2017 at 13:26
  • 3
    $\begingroup$ Actually, you have outliers in other variables as well - at least variables 2, 4 and 7, but it is hard to see them because of the scale of your chart. $\endgroup$
    – G5W
    Commented Feb 12, 2017 at 14:19
  • 1
    $\begingroup$ And those points in the boxplot can be outliers according to some rule of thumb used in plotting whiskers, but they don't seem outliers for practical purposes. $\endgroup$
    – Pere
    Commented Feb 18, 2017 at 19:35

2 Answers 2

7
$\begingroup$

The number of visitors is a counted variable and I would expect it to be highly skewed. A first model to try might be Poisson regression, which is equivalent to working on a log scale (specifically, the link function is logarithmic).

As perhaps implied by @Roland in a comment, it's often true that the extreme values no longer seem outliers with the right model.

Intuition and even experience based on plain or vanilla regression model with a prejudice that normal distributions are the reference doesn't really carry over to count regressions where skewness is customary and symmetry unusual.

There are many, many threads on outliers here and a consensus in those threads I have read that looking to replace outliers is misguided unless you have independent evidence that an outlier is a measurement error. Here is one thread on Replacing outliers with mean, but look at any that is highly upvoted.

In your application your outliers are your biggest sources of visitors and it's as absurd to leave them out as it would be to omit the Amazon from a set of big rivers because it's the very biggest on most measures, or China and India from a list of country populations.

$\endgroup$
-1
$\begingroup$

You should look at multivariate outliers as described in Gnanadesikan's book on multivariate analysis. My paper on the influence function and its application to data validation provides examples using the Pearson correlation coefficient and $R^2$ as examples for bivariate and more general multivariate distributions.

$\endgroup$
1
  • 4
    $\begingroup$ Could you please explain how $R^2$ might be used to detect multivariate outliers, as this post seems to suggest? $\endgroup$
    – whuber
    Commented Feb 13, 2017 at 23:14

Your Answer

By clicking “Post Your Answer”, you agree to our terms of service and acknowledge you have read our privacy policy.