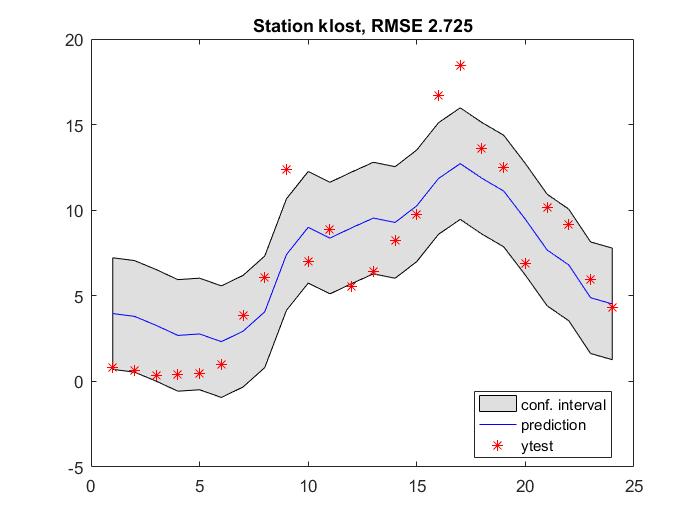
I used Gaussian Process Regression to predict a time series, what I have is sensor's readings that come every hour ( I have data for about 3 years) I chose a periodic kernel function which looks like this
$$ K(x,x′)=\sigma_1^2 \exp(−2\sin^2(π|x−x′|/24)/\mathcal{l_1}^2)+\sigma_2^2 \exp(−2\sin^2(π|x−x′|/8)/\mathcal{l_2}^2) $$
I got the following predictions
 However, the confidence interval looks very weird, (same size along the predictions, and wide even around the data), I can't understand why I am getting this answer, can anyone explain to me what's wrong in my work!?
Briefly, this is what I do :
- I get the data (sensor readings) and prepare training ($$ y(N*1) $$) and testing data ($$ y_{*}(M*1) $$) from the readings and preparing two corresponding series of numbers $$ x=[1,2,3,....N] $$ and $$ x_*=[1,2,3,....M] $$
- Estimate the parameters using maximum likelihood
- Calculate $$ K(x,x) +\sigma_{nois}, K(x_*,x)$$ and $$ K(x_*,x_*)$$
- Calculate $$ L=K(x_*,x)*{K(x,x)}^{-1} $$
- Calculate $$ Prediction=L*y $$ and $$ Covariance =k(x_*,x_*)-L*K(x,x_*)$$
- Calculate the confidence interval like this:
$$ lower=Prediction+0.95*sqrt(Covariance) $$ $$ upper=Prediction-0.95*sqrt(Covariance) $$
- Do I do anything wrong?! what is the problem?!
- Is it right to consider the input (the time) in this way? and for the prediction mode, if I am going to predict the coming 24 hours should my input be $$ x_{pre}=[1,2,3,....,24] $$
