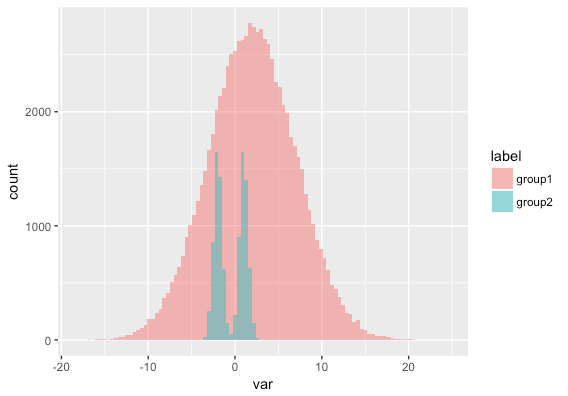
I have two groups, Group 1 and Group 2, where the distribution of var is quite different. However, Group 1 has much more people than Group 2, and the support of Group 2 is a subset of the support of Group 1. That is, for every person in Group 2 with a given value of var, I would expect there to be a person with nearly the same value in Group 1. Here is an example:
require(ggplot2)
group1 <- rnorm(n = 8E4, mean =2, sd= 5)
group2 <- c ( rnorm(n = 5E3,mean =-2, sd= 0.5), rnorm(n=5E3, mean = 1, sd = 0.5))
label <- factor(c(rep("group1", 8E4), rep("group2", 1E4)))
var = c(group1,group2)
mydata <- data.frame(var,label)
ggplot(mydata, aes(x = var , fill=label))  + geom_histogram( position="identity", alpha=0.5 , bins = 100 )
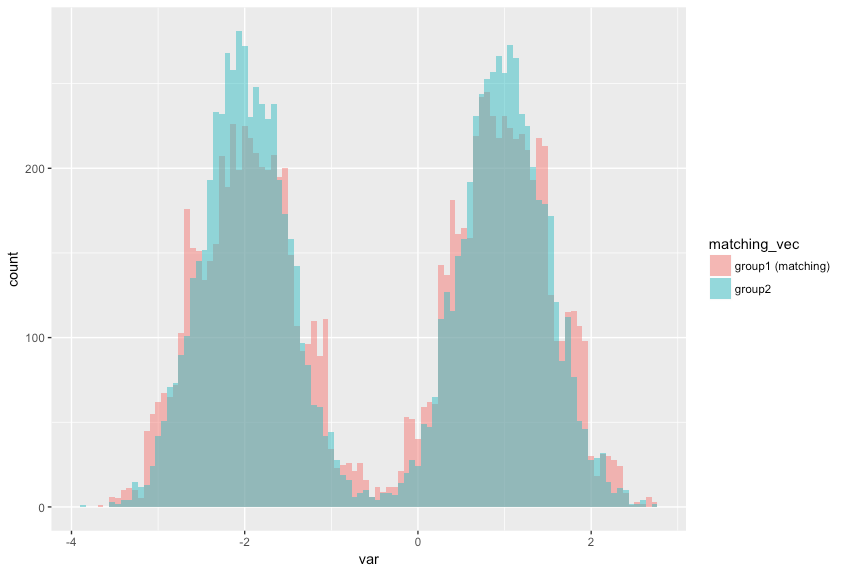
I would like to find a subset of Group 1 that has the same distribution of Group 2. I did so quite simply by using a simple histogram based density estimator, I estimate the density of the two distributions, and then sample from group 1 accordingly:
var_cut <- cut(var,breaks = 100)

#Simple density estimators
p_density<- table(var_cut[label == "group1"])/length(group1)
q_density<- table(var_cut[label == "group2"])/length(group2)

#Evaluate density of both distribution at each point of group 1
p <- p_density[var_cut[label == "group1"]]
q <- q_density[var_cut[label=="group1"]]

matching_idx <- sample(which(label == "group1"),sum(label=="group2"), FALSE, q/p )

#plot it
mydata$matching_vec <- rep(NA, nrow(mydata))
mydata$matching_vec[matching_idx] <- "group1 (matching)"
mydata$matching_vec[label == "group2"] <- "group2"
mydata$matching_vec <- factor(mydata$matching_vec)

ggplot(subset(mydata, !is.na(matching_vec))) +  aes(x = var , fill=matching_vec)  + geom_histogram( position="identity", alpha=0.5 , bins = 100 )
What is this called? Are there any theoretical results about this sort of process? Although it seemed to work pretty nicely, it is not perfect--I would love to better understand the theoretical implications of what empirically makes sense.


