I'm working with R since a few months and read the book Discovering Statistics with R by from Andy Field until Chapter 12 by now.
I have some data, which I (for now without any specific reason) want to check for normality.
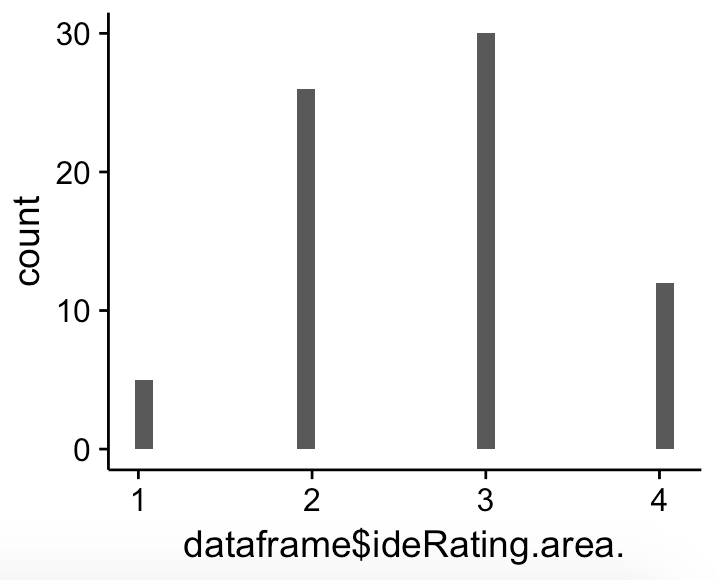
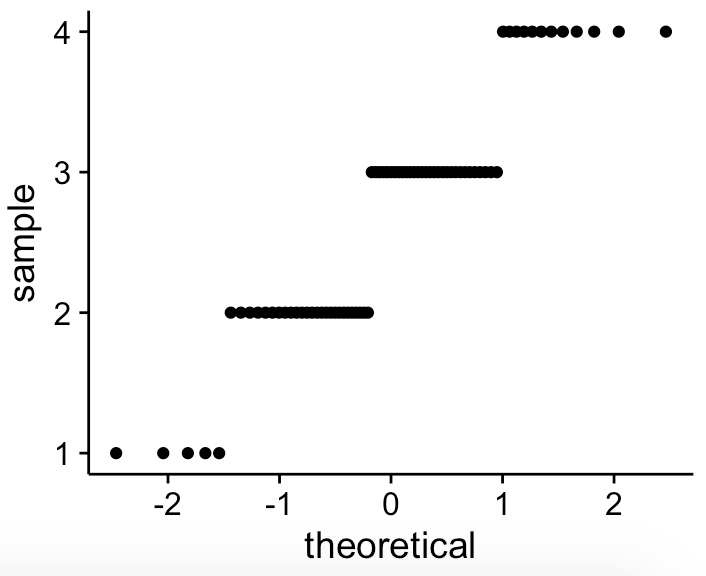
The data was produced by people filling out a online survey and could check an item on a scale from 1 to 4. So obviously the variable is a discrete one, which is (at least I guess) why I get the strange looking qqplot below. What I don't understand is: My data looks (at least to me) quite like a normal distribution.
The p-value computed by R is still < 0.01 and I don't know why. Is the distribution not normal and everything is right, or is the reason that I only have 4 different values? My sample size is above 70.


