2
$\begingroup$

I am looking for a theoretical expression for the ARE of mean and median for student-t distribution against sample size (degree of freedom), exactly the blue curve shown in John Cook's blog. Can anyone point me to the right reference with the expression for it?

Thanks

$\endgroup$
3
  • $\begingroup$ I solved it myself, will post my own answer later :) $\endgroup$
    – Mobius Pizza
    Commented May 18, 2012 at 14:36
  • $\begingroup$ I don't understand the question. What is the population distribution? Is it a normal? a student t? ARE is a limiting property as n goes to infinity. So how do degrees of freedom and sample size enter into this. A good source for these things might be Lehmann's Theory of Estimation book or a good nonparametrics text like Hajek and Sidak The Theory of Rank Tests. $\endgroup$ Commented May 18, 2012 at 17:17
  • $\begingroup$ @ZevChonoles Thanks Michael and Zev. I have done more investigation. Although I can find the theoretical explaination and replicate the curve in the blog link I gave, I found that the result does not match simulation experiment, as Michael pointed out the asymptoptic expression for sample distribution for say, a median estimator, is only valid for large sample size $\endgroup$
    – Mobius Pizza
    Commented May 21, 2012 at 15:14

1 Answer 1

-2
$\begingroup$

Forewarning: The following ARE expression is wrong, the simulation result at the end is more correct

Following steps from this paper reference

For an arbitrary distribution $\mathcal{F}$ with probability density $f(x)$ Asymptoptic relative efficiency (ARE) between median function and mean function for estimating the central parameter $\theta$ is: $4[f(\theta)]^2\sigma^2_F$ (from 1).

The ARE for a Student-t distribution is then found by substituting $f(\theta=0)$ of a Student-t distribution which yields:

$\operatorname{ARE}=\frac{4\nu}{\nu-2}\left\{\frac{\Gamma\left(\frac{\nu+1}{2}\right)}{\Gamma\left(\frac{\nu}{2}\right)\sqrt{\nu\pi}}\right\}^2$ for $\nu>2$

However, due to the expression made for the sample distribution of a median function is only valid for large sample size (again refer to 1), the ARE expression above does not really reflect reality. In fact, an interesting behavior is found in simulations.

Using MATLAB software and generating a Gaussian distributed random process with variance of unity and zero mean is sampled $N$ times to generate $N$ samples. The mean function and median function is used to estimate the location (central tendancy) of these samples. We are in effect estimating the population mean of the Gaussian population, which is zero. Theory dictates the sampling produces Student's $t$-distribution with degrees of freedom equal to $N-1$. This is repeated 10 million times and the variances are computed for both mean and median functions, their ratio is the Relative Statistical Efficiency. This experiment is performed for $N$ from between 2 to 16 inclusive.

The result is plotted below:
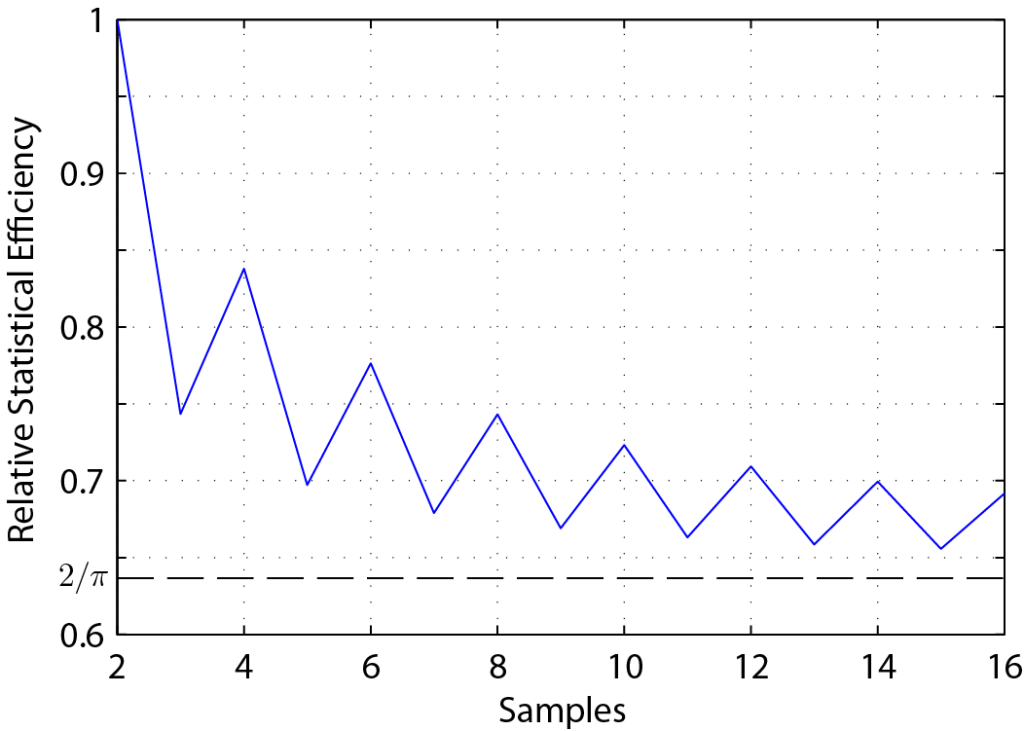
Relative Statistical Efficiency simulation

One can observe the zig-zag trend showing a dependence on whether sample size is even or odd. This is because the median is calculated differently depending if the sample size is even or odd: pairwise mean is calculated at the last step for even sample sizes. This is also why when sample size is two, the RSE is exactly one, as pairwise mean and median are essentially the same mathematical operation. It is interesting to see even sample size result in a higher efficiency for the median estimator.

The $\pi/2$ line is ths asymptote representing the ARE (for $N=\infty$) as noted in 1.

1 R. Serfling, 'Asymptotic relative efficiency in estimation', in International Encyclopedia of Statistical Science, M. Lovric, Ed., vol. 1, London: Springer, 2011, pp. 68–72.

$\endgroup$
3
  • 2
    $\begingroup$ I much doubt that you can prove Serfling wrong by simulation. Moreover, if you are interested in the mean and the median of a Student distribution, you should've sampled from the Student, not from the normal. So if you needed to create say a sample of $N=10$ from $t(5)$, you should've sampled 50 Gaussians and take the mean of the first 5, the next 5, etc. to produce 10 data points. $\endgroup$
    – StasK
    Commented Jun 11, 2012 at 12:54
  • $\begingroup$ @StasK I think you are misunderstanding the problem at hand. I sampled from Gaussian. I have not disproved Sterfling. Here I found that, asymptopticity cannot be applied to a specific scenario: Student-t distribution of sample data, which are obtained by sampling a parent Gaussian distribution. The Relative Efficiency exists for a giving DOF, just not the ARE. This is simply because asymptotically if you draw many samples, Student-t becomes Gaussian and you cannot preserve the DOF in doing so, i.e. there is no such thing as 10 DOF when you have to use infinite samples to get asymptoticity. $\endgroup$ Commented Jun 22, 2012 at 10:08
  • $\begingroup$ @Mobius Pizza; I am interested in the method / formula which computed the values of the RSE Graph above. Can you detail the same for me? As to how we get the following values: "1.000" "0.743" "0.838" "0.697" "0.776" "0.679" "0.743" "0.669" "0.723" "0.663" "0.709" "0.659" "0.699" "0.656" "0.692" $\endgroup$
    – Juggler_IN
    Commented May 26, 2020 at 13:27

Your Answer

By clicking “Post Your Answer”, you agree to our terms of service and acknowledge you have read our privacy policy.

Not the answer you're looking for? Browse other questions tagged or ask your own question.