I set up a model in keras (in python 2.7) to predict the next stock price in a particular sequence.
The model I used is shown below (edited to fit this page):
model = Sequential()
model.add(Dense(5, input_shape=(1, 1)))
model.add(LSTM(5, return_sequences=True))
model.add(Dense(1))
model.add(Activation("linear"))
model.compile(loss="mse", optimizer="Nadam", metrics=["mape"])
predict = model.fit(X, Y, epochs=epochs, verbose=1, validation_split=0.2,
                    callbacks=[checkpoint_maker], shuffle=True,
                    batch_size=count / 10 * 8)
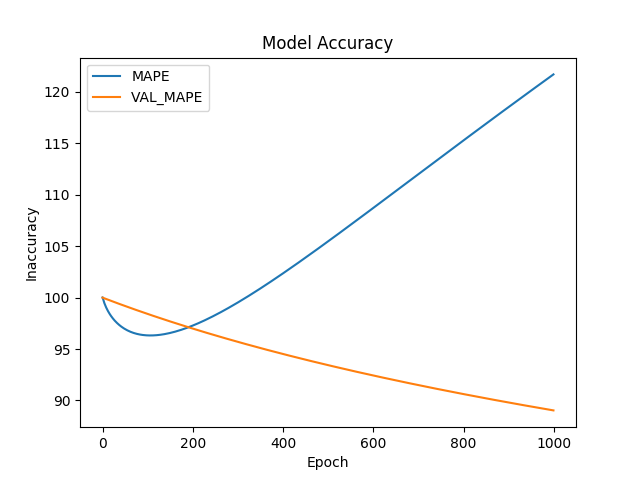
However, when I ran the model, I found that val_mean_absolute_percentage_error decreases while the mean_absolute_percentage_error increases.
Here is the graph I managed to generate after 1000 epochs.

Notice that the blue line is going up while the orange line is going down.
I have no idea why.
I've read on some sources that if the loss is decreasing and the val_loss is increasing it means that:
(the) model is over fitting, that (it) is just memorizing the training data - https://stats.stackexchange.com/a/260346
So does that mean, that in my case, the model is "under fitting"?
P.S. Code and files
