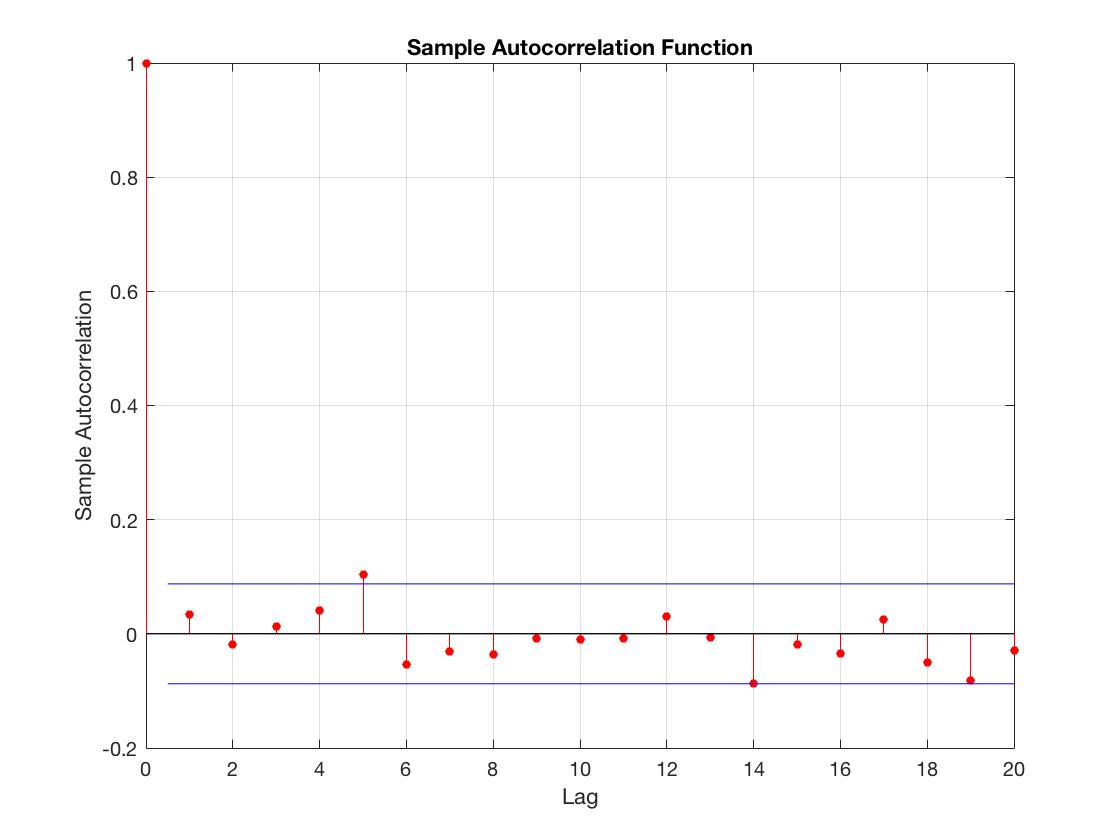
In this case, I would not conclude the ACF plot as evidence that the data is not from a random/white noise process.
Note: Blue lines in these plots often indicate 95% confidence intervals. As such, there's a 1/20 probability that one of the lags will be significant due to random chance.
In your scenario, this appears to be exactly what has happened. Only one of your 20 lags (excluding the first lag, which always equals 1) shows significance. And the significance is not strong. And it's at a lag, which does not make contextual sense with your data.
Conclusion: This appears to be an ACF plot for white noise.
Suggestion: Don't forget to check PACF plot as well. Other ways to check for seasonality would be with a Periodogram, and by investigating the time series plot in general.
Hope this helps!
Edit: As @IrishStat aludes to in his answer, understanding the underlying process of a sample can not be determined by the ACF alone. If you are unfamiliar with Time Series methods, seek out a professional that specializes in it (in person) and have them help formally answer your question. Best of luck!

