7
$\begingroup$

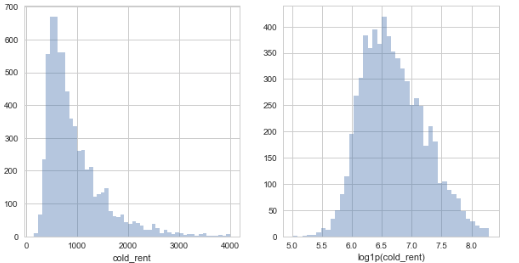
I have rental prices of the houses, the distribution is a bit skewed (1.84 by scipy.stats.skew).

Fig. 1: Image1

I run XGBRegressor on non-transformed data (1.) and on log-transformed target variable (2.). In 2. I also exponentiate the target variable (bringing in to the raw scale) to compare the residuals plots.

  1. I run XGBRegressor on non-tranformed data and I get test RMSE: 177 and a following residual plot and predicted vs real prices. The plot exhibits that data suffer from heteroscedasticity.

Fig. 2:Image2

  1. If I run XGBRegressor on log tranformed data, I get test RMSE: 180.5 (if I exponentiate back) and a following residual plot and predicted vs real prices (on log data).

Fig.3Image3 If I exponetiate the log target variable and predictions from 2. I get following plots. They look almost as the plots from 1. and it shows the same problem with heteroscedasticity. So, I did not get any improvement.

Fig.4:Image4

My questions are:

  1. From what I see, the log transformation did resolve the skewness but it did not improve the RMSE (I guess it is because I use a non-linear algorithm, so the algorithm is not affected by the skewness). That means, I should not log transform it and do not pay attention to the residual plots. Is it correct?

  2. Should I be bothered by the skewness when I use non-linear regressors and should I do log transformation? If not, but I still see the improvement in metrics (RMSE) on the log-data, am I allowed to say: 'I logged it because it gave me the improvement in my metrics' (that sound as a very weak argumentation)? What is the explanation for this behaviour? Is it because of convergence of the optimisation algorithm?

  3. Also, is a residual plot still a good diagnostics when I use a non-linear regressor?

  4. When I use a linear regressor and my data is skewed, but the RMSE of non-transformed data is lower than of log-transformed data, what should I do and what does it mean (or why does it happen)?

$\endgroup$
2
  • $\begingroup$ Are the residuals and fitted vs predicted you're plotting from out of sample data, or from the same data on which you fit the model? $\endgroup$ Commented Dec 24, 2017 at 14:28
  • $\begingroup$ That re from the test set $\endgroup$
    – kkk
    Commented Dec 26, 2017 at 8:43

1 Answer 1

7
+50
$\begingroup$

Although your question seems to be based on use of a boosted regression tree algorithm (XGBRegressor, with which I have no experience), your issues seem to be some that are also faced in standard linear regression, on which I base much of my answer. How to proceed depends on what you are trying to accomplish. To start, a few issues need to be clarified.

First, a regression model is typically considered linear if it is linear in the parameters. In this terminology, non-linear transformations of predictor variables or outcome/target variables do not by themselves make a model non-linear. As you are evidently using boosted regression trees instead of a classical linear regression, it's not clear that the linear/non-linear distinction really applies, anyway.

Second, there is no need for the target variable to have a symmetric distribution in standard linear regression, although that can help with regression trees. As your appropriate focus on the residual plots indicates, the distribution of residuals is important.

Third, RMSE of your entire data set (which is what you seem to be showing) might not be the best measure of the quality of your model. Particularly if you intend to use the model for predictions on new cases, cross-validation or bootstrapping could provide much better estimates of such future performance.

Now to your questions:

  1. The regressions for the linear and log-transformed prices attempt different things: the first tries to minimize the error in absolute terms (e.g., dollars), the second tries to minimize the error in relative/fractional terms (e.g., percentage error in predicted price). Which type of error do you care about for your application? If you care more about fractional errors, you should use the log transform and you shouldn't worry that the error in absolute terms appears bigger when you back-transform from the log scale. You should always, however, pay attention to residuals in whichever scale you choose.

  2. Skewness in the target variable is an issue in standard linear regression provided that some predictor variables are also appropriately skewed so that residuals are not skewed. Transformation of both predictor and target variables is often needed to meet the assumptions of a linear regression and to produce well-behaved residuals. With tree-based regression approaches that use mean values of target variables to choose cutoffs for trees, removing skewness in the target variable can be recommended; the authors of ISLR do a log transform for this purpose in their example of a regression tree (pp. 304 and following). Log transformation means that residuals will be in fractional rather than absolute terms, which seems to make sense for these types of data.

  3. You should always pay attention to residual plots.

  4. Comparing the RMSE of the regression for non-transformed prices against the exponentiated RMSE of the regression for log-transformed prices isn't always very useful. In your log-transformed analysis, the case with the largest absolute error in the log (fractional) scale is also the lowest in absolute predicted price. That case will make a large contribution to the RMSE error in the log-transformed scale (as will several other low-price cases), but perhaps a very small contribution to RMSE in absolute terms in the regression for non-transformed prices. That might account for your observation.

In terms of how to proceed, it looks like the log-transformation of prices is useful but that your model doesn't deal too well with some of the most extremely low prices. You might need to incorporate your knowledge about the underlying subject matter, e.g. whether there is something special about such cases (other than that they don't fit well) that make them inappropriate to include in the model (for example, you might need to exclude all rents that are charged among family members, which might be lower than market rents, or rents in otherwise subsidized units if any), or whether transformations of some predictor variables might improve performance. Different choices of the tuning parameters for the boosting might help. And again, you should consider a different measure of model quality than RMSE on the entire data set.

Finally, the classic linear regression approach can outperform tree-based approaches in many situations. You could try a standard linear regression with appropriate knowledge-based selection and transformations of predictors and target variable values, with cross-validation or bootstrapping to validate your modeling approach.

$\endgroup$
6
  • $\begingroup$ I show here test RMSE and not of the whole dataset,which is a good estimator of the performance already.In ISLR they did the log-transformation only to have a bell-curve data, nothing else is mentioned.Regarding the argumentation about skewness and mean values to choose cutoffs,the index of the mean in non-transformed variable equals to the index of the mean in log-transfomed,so there is no influence of the log-transformation. $\endgroup$
    – kkk
    Commented Dec 27, 2017 at 15:02
  • $\begingroup$ The only reason I see to use RMSLE is because of the correct residual plot in 2. on log data.Regarding the concept of "what to minimize",rmse of log of target variable (RMSLE) will penalize big and small differences in the same way, big differences can contribute more to the RMSE.If I get test RMSLE of 0.12,does it tell me that deviation is within 1.2. times bigger or smaller of the actual measurement? Whereas with RMSE of 180, I know that the user should be account for +-180 within the predicted value. $\endgroup$
    – kkk
    Commented Dec 27, 2017 at 15:17
  • $\begingroup$ @JekaterinaKokatjuhha As a sum in a log scale is a product in the original scale, exponentiating +/- the root-mean-square error in a natural-log scale gives the factors by which to multiply the predicted value in the original scale to get the corresponding range with errors. For reasonable values of RMSLE in a natural-log scale, these are close to fractional errors, or equivalently 100 times the RMSLE is close to the percentage error. For your example with 0.12 RMSLE, exp(.12) = 1.127, exp(-0.12) = 0.886, or about 12% error in the original scale. $\endgroup$
    – EdM
    Commented Dec 27, 2017 at 16:37
  • $\begingroup$ @JekaterinaKokatjuhha even if tree cutoffs chosen for non-transformed and log-transformed data points are the same, a boosted regression model is explicitly fit to residuals of the model as it is grown (ISLR, p. 322), so the issue of "what to minimize" in terms of absolute versus relative (log-scale) errors is a central (if not always appreciated) part of the model building. $\endgroup$
    – EdM
    Commented Dec 27, 2017 at 17:46
  • $\begingroup$ Got. One last regarding " ..it looks like the log-transformation of prices is useful but that your model doesn't deal too well with some of the most extremely low prices. [..]". I agree that based on the residual plots (fig 2 and fig 3), I need to log transform because the residuals plots of the log transform show no pattern. However, from those plots (Fig 3) I do not see that the model does not do well with low prices. It is seen only on Fig 2 (not log-transformed). That means, that the model in log-transform also deals well with extremely low prices. Is it correct? $\endgroup$
    – kkk
    Commented Dec 27, 2017 at 22:08

Your Answer

By clicking “Post Your Answer”, you agree to our terms of service and acknowledge you have read our privacy policy.

Not the answer you're looking for? Browse other questions tagged or ask your own question.