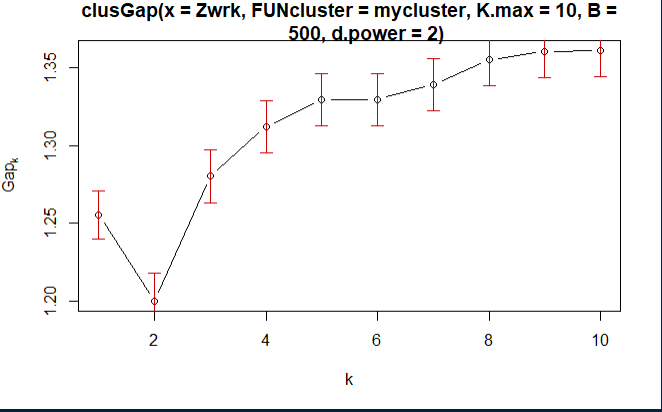
I´m having trouble deciding how to cluster my data based on this following analysis. I used clusGap in R, which gave me the following plot.
Provided I understand the whole thing correctly, I should be using 5 clusters based on this graph, because that´s the first k, where f(k) >= f(k+1)-SE(k+1). Right?
The problem is, the function itself sugests I use 1 cluster (ie no clustering), which I suppose makes sense, if you assume k=1 fulfills the first criterion too, given that f(k=2) is so very small. I´d happily use only one, too, but then NbClust suggests I use 2 clusters, no matter which precise method it uses.
As such, I´ve now completely lost my thread, and have no idea which clustering to use and why.

