1
$\begingroup$

Forgive my ignorance, I am not a mathematician or statistician. I'll try to explain as clearly as I can.

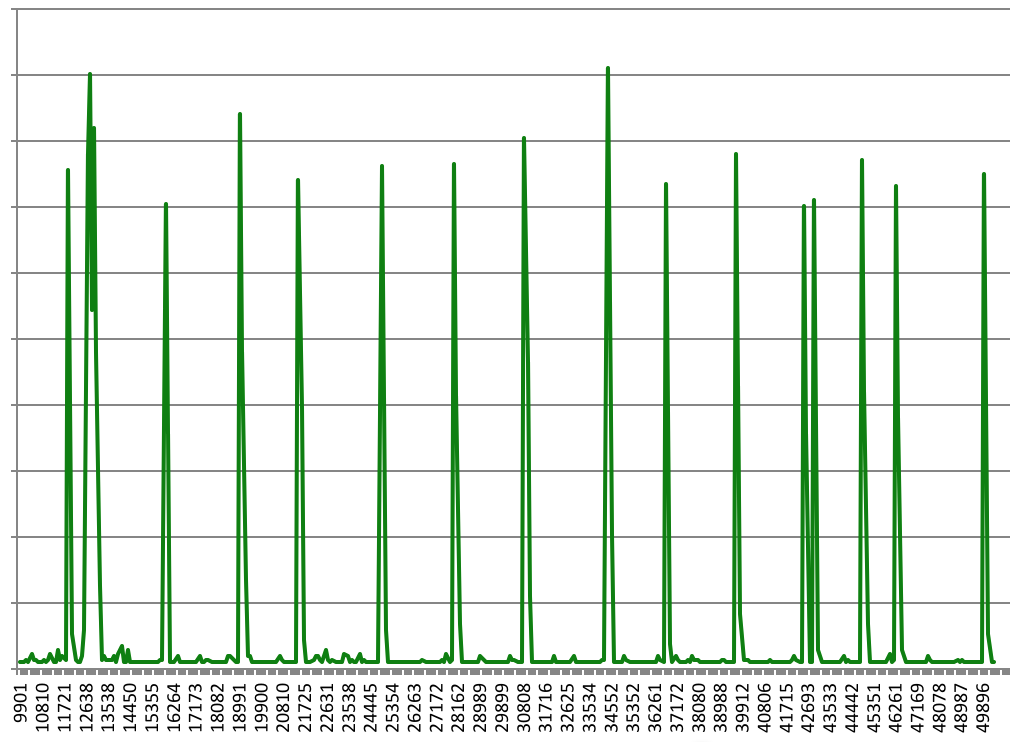
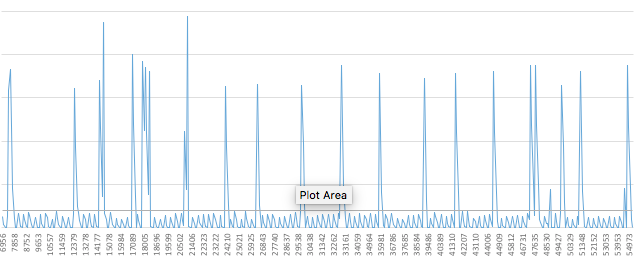
I have a dataset (image below). The data represents delays of some signal over time. The large "spikes" are caused by incorrect predictions - when an incorrect prediction is made, the delay increases sharply. However, noise and whatnot causes some smaller spikes to occur between the larger ones.

I want to define a metric which will describe how "stable" or "jumpy" my data is, if that makes any sense.

Variance tells us how far values are from the mean, but in my case the large spikes will give too much weight and not give me any information about the smaller spikes. I thought about if I normalise my values and then calculate the variance... but I'm not sure... I've also read about the "index of dispersion", but I cannot tell if this is what I'm after. It's all very confusing to me!

Consider this graph:

enter image description here

And compare it to:

enter image description here

Graph 1 is far more stable: both encounter incorrect predictions (large spikes), but when predictions are correct (between the large spikes), there is a clear difference between the two graphs.

I thought that perhaps this is what I can do:

  • normalise all data points (I want a score between 0 and 1)
  • Sum the normalised values
  • divide the sum by the number of data points.

Like in this Python 3 program:

import random

vector = [int(100*random.random()) for i in range(10)]
print(vector)

min_value = min(vector)
max_value = max(vector)
normalised = [(value-min_value)/(max_value-min_value) for value in vector]
print(normalised)

answer = sum(normalised) / len(normalised)
print(answer)

My question is: Have I done this correctly, or is there another/better way to do this?

$\endgroup$
6
  • 1
    $\begingroup$ Your question is unclear. Are you asking about a single number that measures the jumpiness of your whole time series? (if so, the mean may be fine: because it is sensitive to extreme values if it deviates from the median by more than a set amount that may work swell). OTOH, if you are interested to know if a particular data point during your time series is in a jump: the extremity of the jumps would seem to make a threshold above a certain value correspond to "in a jump." Finally, another way to describe jumpiness would be the proportion of data points that are "in a jump". $\endgroup$
    – Alexis
    Commented Apr 23, 2018 at 21:18
  • $\begingroup$ @Alexis My question is about a single number. I can't use the mean because in my updated question, I'd say graphs 1 is better than graph 2 and if I used the mean, it would not tell me how "choppy" or "jumpy" the values are. Sorry, I don'y know if I'm making sense. $\endgroup$
    – pookie
    Commented Apr 23, 2018 at 21:32
  • $\begingroup$ So would a proportion of the time spent in those transient spike work for your purposes? (e.g, proportion of values above that first horizontal line?) $\endgroup$
    – Alexis
    Commented Apr 23, 2018 at 22:05
  • $\begingroup$ A very quick and dirty approach would be this: use the median as a low pass filter. A "moving" median with a large enough window will zero all those very large spikes in both graphs, but it should still show up as a higher number in graph 2 than 1 (which is I think where you are going with graph 1 being more stable). $\endgroup$
    – CarrKnight
    Commented Oct 6, 2021 at 9:51
  • $\begingroup$ Some closely related threads offer solutions that might work for you, including stats.stackexchange.com/questions/587385 and stats.stackexchange.com/questions/1142. $\endgroup$
    – whuber
    Commented Feb 23, 2023 at 15:28

1 Answer 1

0
$\begingroup$

You might look at control charts maths, to identify the areas of your dataset which are stable.

An example of the python code you would use is provided here: https://medium.com/swlh/process-stability-analysis-with-python-798c4ebdd08a

Hope that helps.

$\endgroup$
1
  • $\begingroup$ Any decent (or even poor) control charting method will detect all these spikes, including the small ones -- but how would that help? $\endgroup$
    – whuber
    Commented Feb 23, 2023 at 15:27

Your Answer

By clicking “Post Your Answer”, you agree to our terms of service and acknowledge you have read our privacy policy.

Not the answer you're looking for? Browse other questions tagged or ask your own question.