0
$\begingroup$

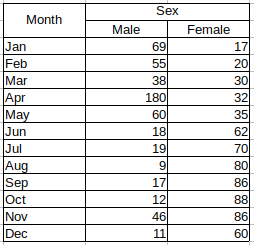
I have a data something like this. The numbers are the count of identified male and female of fish Decapterus russelli (Indian scad). I wanted to know if there's a difference in the sex ratio per month. Is chi-square goodness-of-fit appropriate for this data? If yes, how should I do it? If no, what is the best statistical tool to use?

enter image description here

I read that binomial test is enough to compare male and female. Here's the link: How to (properly) analyze the sex ratio. But in my case I have several data, and group per month.

$\endgroup$
9
  • 1
    $\begingroup$ Could you elaborate on what you mean by "I wanted to know if there's a difference in the sex ratio per month"? Are you testing if January is different from each subsequent month? Are you testing if the sex ratio is different from 50% each month? Are you trying to see if there is some relationship like, "as the year progresses, it becomes more female"? $\endgroup$
    – Mark White
    Commented Jul 11, 2018 at 1:50
  • $\begingroup$ Yes, I wanted to know if the sex ratio is different per month, i.e., if the ratio of male to female changes per month. In addition, if the ratio deviates from the theoretical concept of 1:1 (male:female) ratio. $\endgroup$
    – J. Biv
    Commented Jul 11, 2018 at 2:00
  • $\begingroup$ One difficulty here might come from the temporal nature of the data. Are the males and females in each month sometimes the same people? So Jim is present for January - Jun and then drops out, while Mary is only present in November and December? Or is each month independent samples of people? $\endgroup$
    – Mark White
    Commented Jul 11, 2018 at 2:02
  • $\begingroup$ Aw. Sorry, my mistake. I will edit the question. The data is the count of male and female fish Decapterus russelli. Each month is an independent samples of fish. $\endgroup$
    – J. Biv
    Commented Jul 11, 2018 at 2:06
  • 1
    $\begingroup$ @J.Biv The fact that you did not tag the fish does not make the fish unique..(it only means that you cannot tell). If each sample was selected at a different port that would make them unique. $\endgroup$
    – Tom
    Commented May 4, 2021 at 8:57

1 Answer 1

-1
$\begingroup$

Your question is if the sex ratio of Indian scad deviates from 1 (male = female)? Ho = 1 Ha # 1 You may calculate the sex ratio for each month and compare it with 1 using one-sample t-test (if data are normally distributed) or one-sample sign test (if data are not normal). If null hypothesis is rejected then there is evidence to conclude that the sex ratio deviated from 1 which also implies the sex ratio each month is different.

$\endgroup$

Your Answer

By clicking “Post Your Answer”, you agree to our terms of service and acknowledge you have read our privacy policy.

Not the answer you're looking for? Browse other questions tagged or ask your own question.