0
$\begingroup$

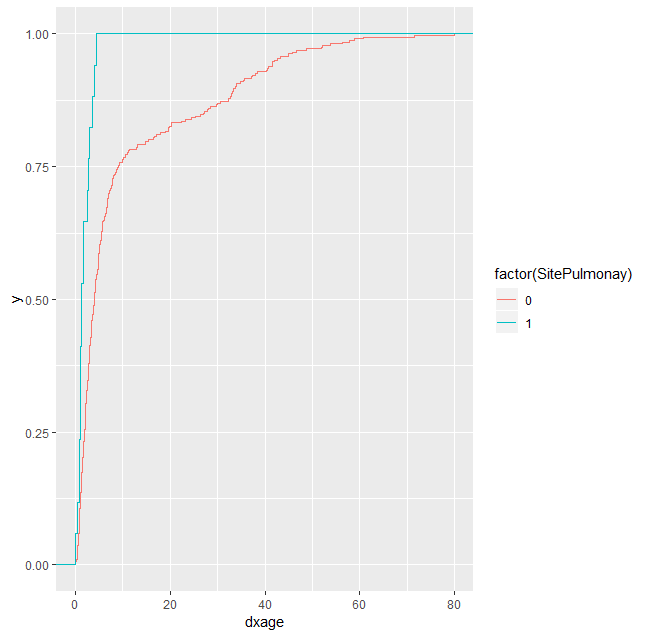
I study a rare disease (recurrent respiratory papillomatosis (RRP)) and have accumulated data on hundreds of patients and the age at which they were diagnosed. Only a few (17) ever went on to develop the dreaded complication of pulmonary involvement. They were all patients who were diagnosed before the age of 5. But then again about half of all patients in our sample are diagnosed before the age of 5. I am able to easily use R to figure out, in our specific cohort, the oldest diagnostic age of any patient who subsequently developed pulmonary involvement.

data.table [SitePulmonay==TRUE, max(diagnostic.age)]  

I am also able to use the ecdf() function and can use ggplot to visualize

Empirical cumulative distribution (ECDF).

enter image description here

How do I calculate the 95% confidence interval, or any confidence interval. I want to determine an age of diagnosis above which there is only a 2.5% probability of ever going on to develop pulmonary involvement. Ideally I would like to implement in R. Since I only have 17 patients with pulmonary RRP, I cannot simply believe that our maximum diagnostic age is THE maximum diagnostic age. I am not looking for the mean diagnostic age and the 95% interval on that (that would be the sem

$\endgroup$
5
  • 3
    $\begingroup$ You're interested in something like survival analysis: stats.stackexchange.com/questions/tagged/survival $\endgroup$ Commented Jul 26, 2018 at 20:12
  • $\begingroup$ Do you have data on the present ages of your patients, ages of death for those that are dead, and the ages at which they developed pulmonary involvement? $\endgroup$
    – Ben
    Commented Jul 27, 2018 at 0:38
  • $\begingroup$ @Ben alas, no I do not. The data is not that good. that would be ideal. Instead I have the age of diagnosis and the age that they enrolled in a study and whether or not they had or had ever had pulmonary involvement at the time of that enrollment. And that is that. $\endgroup$
    – Farrel
    Commented Jul 27, 2018 at 23:13
  • $\begingroup$ is the last parenthetical sentence correct? Do you mean "same"? or sem - structural equation modeling. $\endgroup$
    – AdamO
    Commented Dec 7, 2022 at 19:04
  • $\begingroup$ Sorry for the confusion. I have no idea why I did not not write it out in full. sem = standard error of the mean. $\endgroup$
    – Farrel
    Commented Dec 9, 2022 at 0:32

1 Answer 1

1
$\begingroup$

Consider that the "controls" in this sample are merely at risk for developing the event. And so it's important to know how long they were measured. 1 year? 5 years? Looking at these CDFs, you might think that early diagnosis is a risk factor for developing the condition, but this is just because they've been observed for longer. This is called lead time bias and it's the nail in the coffin if you don't have person-time follow-up. Kaplan-Meier curves would consider the controls as censored, and the corresponding curve would provide an unbiased estimate of the median time to pulmonary involvement as a number of years from diagnosis.

$\endgroup$
1
  • $\begingroup$ I do indeed know 1) when they were born 2) when they were diagnosed and 3) when they were enrolled in the study (a cross sectional study with very little (about a year of follow up). I know if they had had pulmonary involvement at the time of enrollment or not but I do not know when they developed pulmonary involvement. And once people have developed pulmonary they tend not to go into remission so yes they have longer follow up but I do not know where in that followup the pulmonary was identified. I cannot Kaplan-Meier because I do not know when pulmonary was identified. $\endgroup$
    – Farrel
    Commented Dec 9, 2022 at 0:39

Your Answer

By clicking “Post Your Answer”, you agree to our terms of service and acknowledge you have read our privacy policy.

Not the answer you're looking for? Browse other questions tagged or ask your own question.