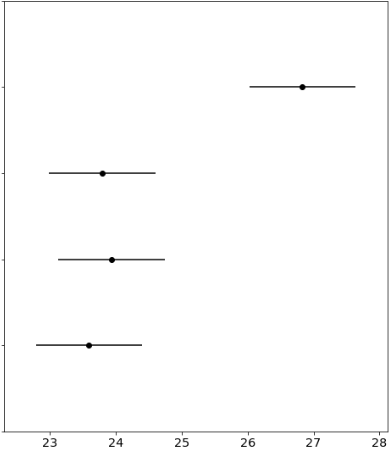
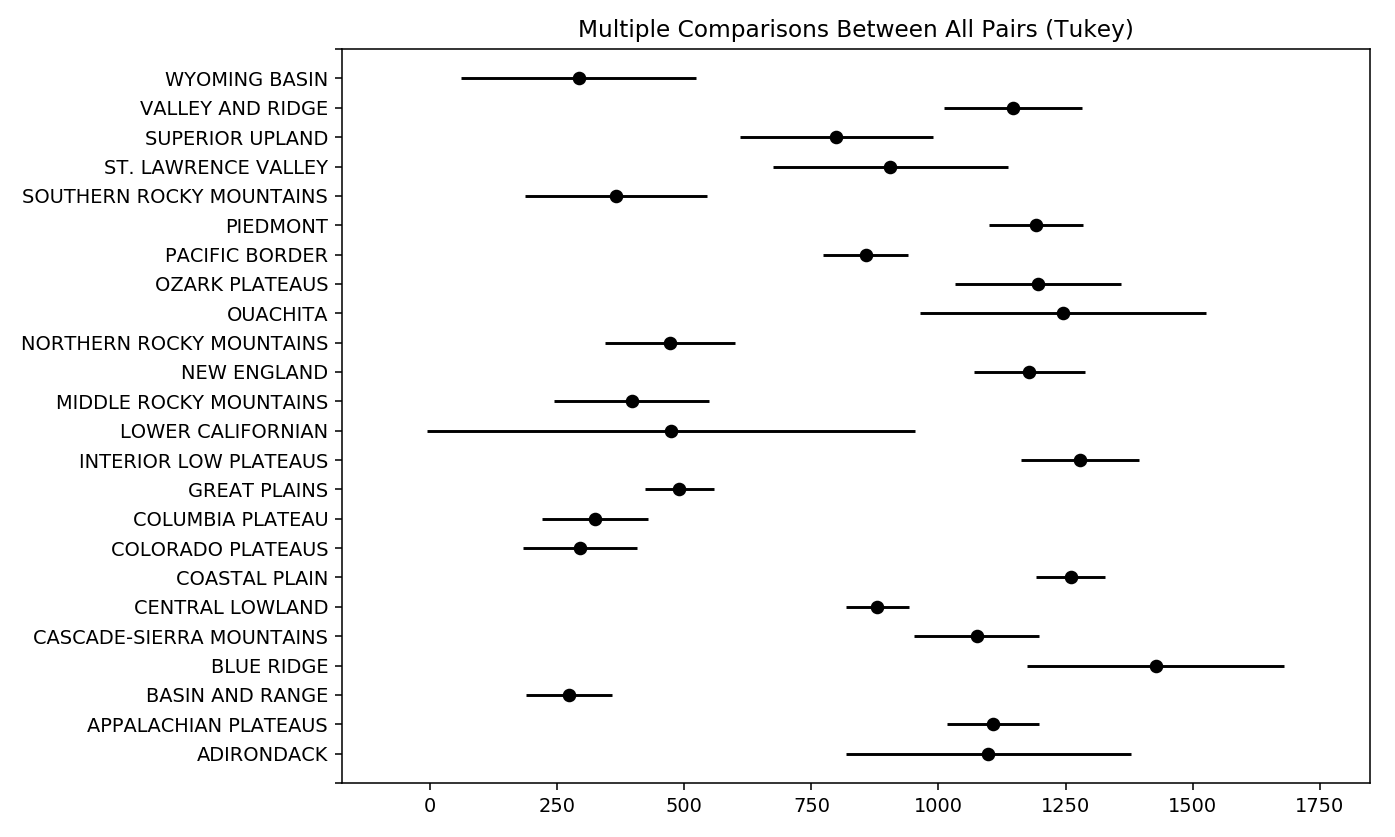
I have performed a Tukey HSD in Python. I am not sure what values are plotted when using the .plot_simultaneous() command (see statsmodels documentation).
The resulting plot is:
I am wondering: how is the resulting mean and std calculated?
How can I interpret the graphic result of this?


