4
$\begingroup$

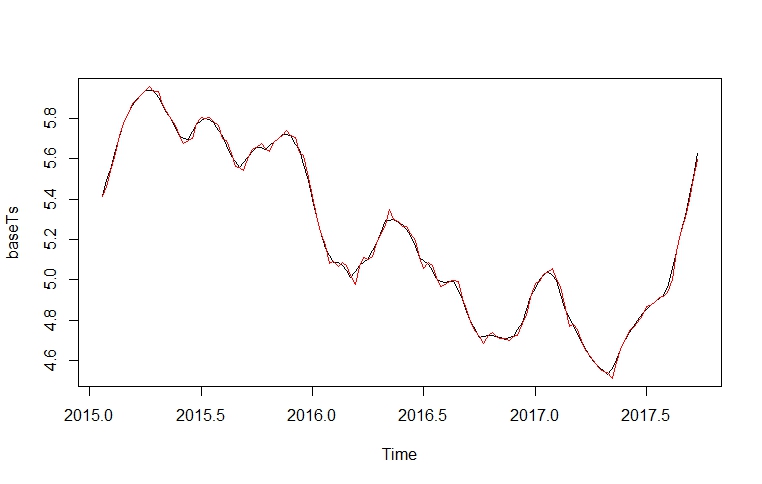
I am using ARIMA (auto.arima) to forecast for 52 weeks. The time series model fits the data well (see plot below, red line is the fitted value). The input data has a decreasing trend.

enter image description here

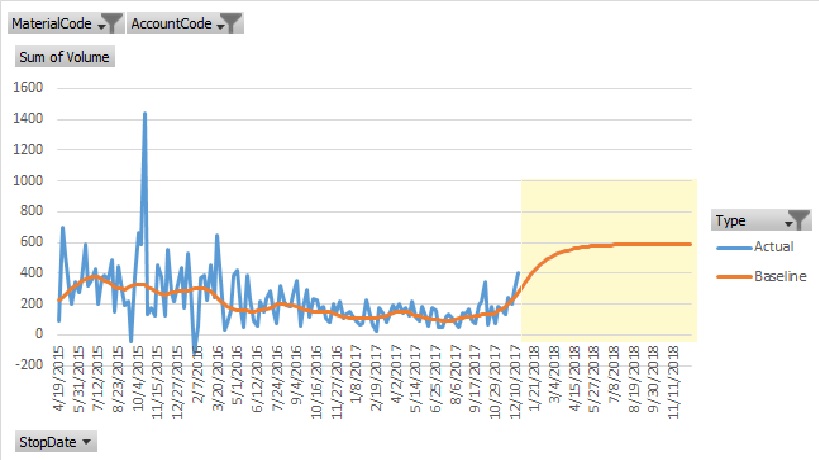
The forecasts (highlighted area) however seems to just taking off after the actual values end.

enter image description here

How can the forecasts be tamed?

dput of the input

> dput(baseTs)
structure(c(5.41951956469523, 5.49312499014084, 5.56299025716832, 
5.64442852110163, 5.71385023974044, 5.77578632033402, 5.82985917237953, 
5.86346591034374, 5.89626165157029, 5.92013286862512, 5.94200331713403, 
5.93996840759539, 5.93917517855891, 5.90355191030718, 5.87180377346416, 
5.83190030607801, 5.79624428055153, 5.75377043604686, 5.71445345904649, 
5.70025269940165, 5.69789272204017, 5.73728731204876, 5.77015169357394, 
5.78936321107329, 5.80113284575595, 5.79449448552444, 5.78193215198878, 
5.74003482344406, 5.71694163930612, 5.66689345413153, 5.614357635737, 
5.58578389962286, 5.55824727570498, 5.58495146060423, 5.61344117957187, 
5.63637441850401, 5.65948408172102, 5.65558124383951, 5.64909390802285, 
5.6664546352889, 5.68205689033408, 5.69991437586231, 5.72273650369514, 
5.72006065065194, 5.71556512542993, 5.6717608006789, 5.64610326418084, 
5.57193975508467, 5.49406607804055, 5.40126523530993, 5.31513540386482, 
5.238437956722, 5.15362077920702, 5.11960611878249, 5.08498887979172, 
5.08408134201562, 5.07361213981111, 5.04830559379816, 5.01401413448689, 
5.0418662607737, 5.06947584464062, 5.08771495309317, 5.10587165060358, 
5.1438369937098, 5.1815251206981, 5.2318657906363, 5.29385492077065, 
5.29652029253008, 5.29998067741868, 5.28242409629194, 5.2722770646788, 
5.24927444462166, 5.22226735874711, 5.16555064465208, 5.10956459841778, 
5.09439240612378, 5.07617974794969, 5.04418337811006, 5.0075619037348, 
4.99108423417745, 4.9874504485194, 4.99135285004736, 4.99217791657733, 
4.94874445528885, 4.90320874819525, 4.84508278068469, 4.79086127023963, 
4.75236840849279, 4.71431573721527, 4.71936529020481, 4.72422850167074, 
4.72203091743033, 4.71732868614755, 4.71175323610448, 4.70566162766782, 
4.71165837247331, 4.71767529028615, 4.75129316683193, 4.7863855803437, 
4.85248191548789, 4.91865394024373, 4.9590849617955, 4.99960686851895, 
5.02020678181827, 5.04201201976595, 5.02025906892952, 4.99735920720967, 
4.92520279823639, 4.84822505567723, 4.81118504683572, 4.77330440072099, 
4.72636395544651, 4.6861111959621, 4.64912520396312, 4.61348981514599, 
4.58517820348434, 4.56378688913207, 4.549011597464, 4.52900600122321, 
4.56028365470815, 4.60248987909752, 4.65628990381626, 4.70496326660038, 
4.73779351647955, 4.76616725791407, 4.79569018347378, 4.83185281078024, 
4.85177852259102, 4.87488251014986, 4.89468916229158, 4.9077984323135, 
4.92375782591088, 4.96363767543938, 5.05416277704822, 5.1426680212522, 
5.232495043331, 5.32153608753653, 5.41780853915163, 5.51131526881126, 
5.62791210324026), .Tsp = c(2015.05769230769, 2017.73076923077, 
52), class = "ts")

The code used

fc <- try(auto.arima(baseTs,ic='aic',approximation = F))
baseFc <- forecast(fc,h = weeks_forecasted)
  baseVolume_forecast_new <- baseFc$mean

What could be the reason behind the forecasts exploding?

$\endgroup$
3
  • 2
    $\begingroup$ How do you create your second plot? It does not seem to have anything to do with the data, or the first plot. $\endgroup$ Commented Nov 23, 2018 at 7:01
  • $\begingroup$ @StephanKolassa the second plot is created in excel. The orange line 'baseline' is what we are forecasting. The values in ' baseVolume_forecast_new ' and 'baseTs' has been log transformed and needs to be exponentiated and one subtracted from it,i.e., exp(baseTs)-1. $\endgroup$
    – darkage
    Commented Nov 23, 2018 at 7:48
  • $\begingroup$ It would be easier if you put everything in one graph; now it is difficult to reconcile the two. But I am not surprised that ARIMA forecasts are exploding because the time series (in the first graph) are exploding - the trend just continues upwards. $\endgroup$ Commented Nov 23, 2018 at 10:41

1 Answer 1

1
$\begingroup$

First: thank you for providing your full data.

Let's look at your model:

> fc
Series: baseTs 
ARIMA(1,1,2) 

Coefficients:
         ar1     ma1     ma2
      0.8514  0.0817  0.2643
s.e.  0.0583  0.0909  0.0965

auto.arima() fits an ARIMA(1,1,2) model. Here is background on ARIMA models. That is, the increments in $y_t$ (because of the I(1) integration) are assumed to follow an ARMA(1,2) model. And one with a pretty large AR term, $\hat{\phi}_1=0.8514$:

$$ \Delta y_t = \phi_1\Delta y_t+\epsilon_t+\theta_1\epsilon_{t-1}+\theta_2\epsilon_{t-2}. $$

The key insight from this formula is: if a time series with a large AR(1) term is away from zero, it tends to stay away from zero. In the present case, the time series is the differences in your original series: $\Delta y_t$.

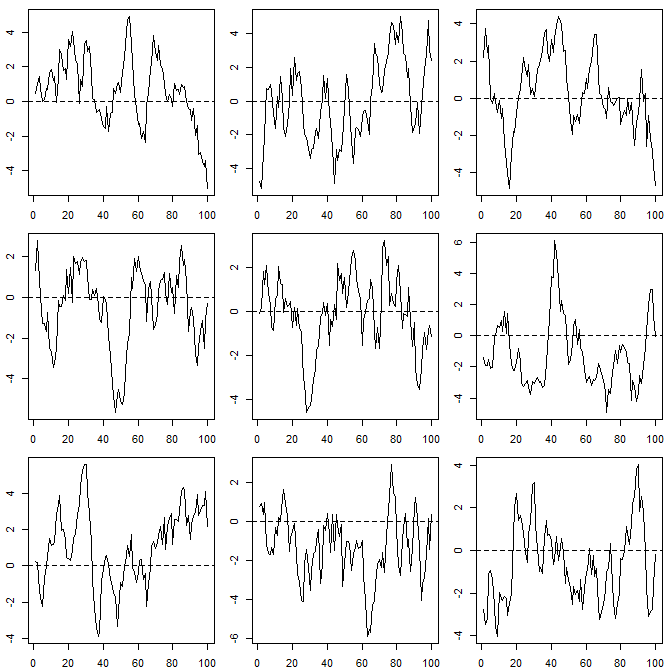
To illustrate, here are a few plots of ARMA(1,2) processes with the parameter values auto.arima() fits to your data:

ARMA simulations

opar <- par(mfrow=c(3,3),mai=c(.3,.3,.1,.1))
    for ( ii in 1:9 ) {
        set.seed(ii)
        plot(arima.sim(model=list(ar=fc$coef[1],ma=fc$coef[2:3]),n=100),
            xlab="",ylab="")
        abline(h=0,lty=2)
    }
par(opar)

Note how these show no tendency to tend towards zero.

Now, all this is on the level of differences or increments in your time series. The last observed differences are:

> tail(diff(baseTs))
Time Series:
Start = c(2017, 34) 
End = c(2017, 39) 
Frequency = 52 
[1] 0.08850524 0.08982702 0.08904104 0.09627245 0.09350673 0.11659683

All are positive. This nicely shows the upward trend present at the end of your observations.

Here are the first couple of differences in your forecasts:

> head(diff(baseFc$mean))
Time Series:
Start = c(2017, 41) 
End = c(2017, 46) 
Frequency = 52 
[1] 0.09647558 0.08214003 0.06993462 0.05954286 0.05069523 0.04316229

Now, because the innovations in the MA(2) terms are set to their expectation in forecasting (which is zero), this does decay to zero. But slowly.

And since, again, we are working on the level of increments, this all translates into a positive forecasted trend that slowly (because of the large $\hat{\phi}_1$) decays towards a zero trend, i.e., a flat line.

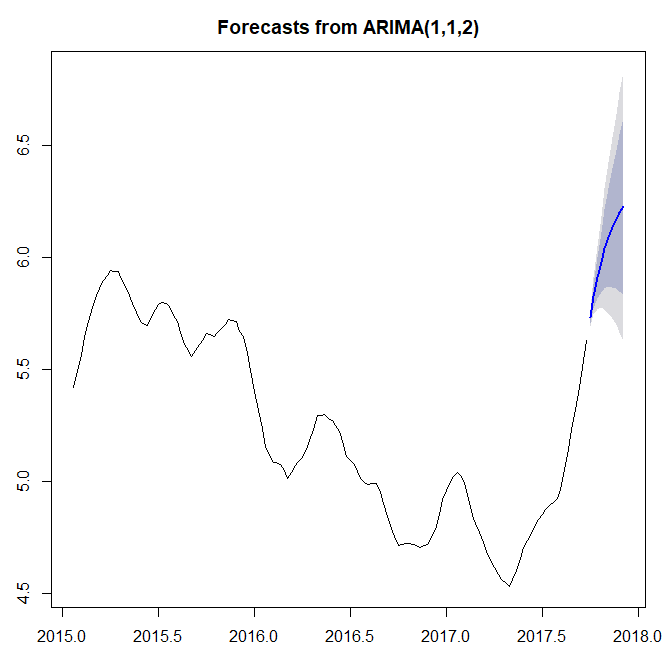
And this is as it should be. auto.arima() has noticed that local trends tend to persist for a while. So it believes that its best bet is to extrapolate the trend it sees at the end of your observations, but dampen it towards zero. Yes, this does mean that your forecast reaches unprecedented levels for this time series - but also note that the most recent trend from about 2017.3 on is also unprecedented, with the series increasing monotonically from an all-time low to almost an all-time high.

Finally, note that auto.arima() is not at all sure that this trend will indeed continue, as we can see from the s:

ARIMA forecast

$\endgroup$

Your Answer

By clicking “Post Your Answer”, you agree to our terms of service and acknowledge you have read our privacy policy.

Not the answer you're looking for? Browse other questions tagged or ask your own question.