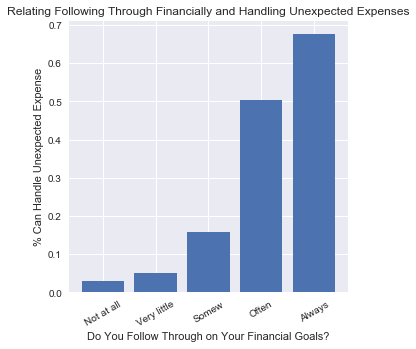
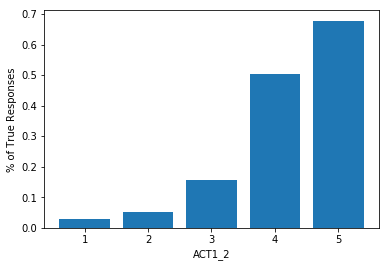
I have a 5-level ordinal independent variable ('ACT1_2') and a Boolean output variable ('target'). ACT1_2 is a response to a survey question. When I was doing some exploratory data analysis, I graphed the percentage of respondents who responded True within each value of ACT1_2. I got the following graph:
There seems to be a pretty obvious positive association with increasing values of ACT1_2 and feeling like one is able to handle unexpected expenses.
However, when I fit a logistic regression model using this variable, I got a negative value for its coefficient. I read that this could be explained by the presence of other variables (although I did try to handle multicollinearity by making sure all my VIFs were less than 10), but the coefficient stayed negative even when I fit a logistic regression model with ACT1_2 as the only variable.
How can I reconcile these two findings?
Relevant code is reproduced below.
import pandas as pd
import numpy as np
import matplotlib.pyplot as plt
import statsmodels.api as sm
%matplotlib inline

df = pd.read_csv('https://www.consumerfinance.gov/documents/5614/NFWBS_PUF_2016_data.csv')

# Remove null values
df = df[(df['FWB1_1'] != -1) & (df['FWB1_1'] != -4) & (df['ACT1_2'] != -1)]
# Create target variable
df['target'] = df['FWB1_1'] > 3

# Frequency table for plotting values
freq_table = pd.crosstab(df['ACT1_2'], df['target'])

num_categories=5

x_vals = np.arange(num_categories) + 1
y_vals = np.empty(num_categories)
# Loop through categories
for i in np.arange(num_categories):
    # Calculate percentage of True responses within category
    y_vals[i] = freq_table.loc[i+1, True] / np.sum(freq_table.iloc[i,0:2])
_ = plt.bar(x_vals, y_vals)
_ = plt.xlabel('ACT1_2')
_ = plt.ylabel('% of True Responses')
X = df['ACT1_2'].values
y = df['target'].values

logit_model=sm.Logit(y,X)
result=logit_model.fit()
print(result.summary2())

Optimization terminated successfully.
         Current function value: 0.681643
         Iterations 4
                         Results: Logit
================================================================
Model:              Logit            No. Iterations:   4.0000
Dependent Variable: y                Pseudo R-squared: -0.034
Date:               2018-11-26 11:50 AIC:              8684.7666
No. Observations:   6369             BIC:              8691.5258
Df Model:           0                Log-Likelihood:   -4341.4
Df Residuals:       6368             LL-Null:          -4198.7
Converged:          1.0000           Scale:            1.0000
------------------------------------------------------------------
         Coef.    Std.Err.      z       P>|z|     [0.025    0.975]
------------------------------------------------------------------
x1      -0.0819     0.0068   -12.0212   0.0000   -0.0953   -0.0686
================================================================


