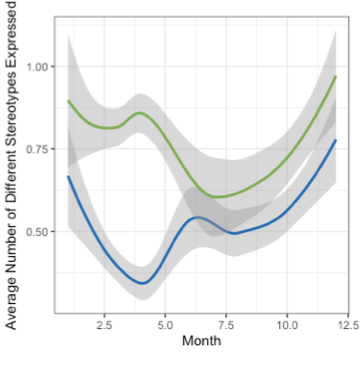
I'm trying to figure out the best way to analyze the difference between sexes and across months for the means of a specific behavior (most individuals measured have repeated measures across the 5 years of the project which will contribute to the mean).
I thought a glmm would be most appropriate with
behavior ~ month + sex + sex*month + (1|Individual ID)
The month is coded as a factor (but with each month represented as a number 1-12) and so is the sex. Behavior is numeric. I need to account for the repeated measures of individuals across years because my samples sizes within a given year weren't always high (working with endangered zoo species but across the data set I do have 101 individuals just not always represented in each year and each month). The data produce the following graph. Males are green and females are blue. It has the general shape I was expecting (males stereotype more during the breeding season and females reduce stereotypes).
I was expecting a significant interaction of sex*month based on the graph but I'm not seeing significance and I'm wondering, since the data are clearly not linear, if a glmm is actually appropriate? Any suggestions on analyses that would be best for this type of data?

