4
$\begingroup$

I have a dataset:

   Year      ContentPublished      ContentViews
2015-01-01       5036                  86
2015-02-01       3563                  88
2015-03-01       5064                  124
2015-04-01       5613                  92
2015-05-01       7060                  87
2015-06-01       7207                  139
2015-07-01       8508                  106
2015-08-01       8046                  128   
2015-09-01       9085                  169
2015-10-01       6667                  95
2015-11-01       7532                  135
2015-12-01       4903                  125
2016-01-01       5538                  103
2016-02-01       4738                  98
2016-03-01       7146                  197
2016-04-01       4335                  105
2016-05-01       6143                  123
2016-06-01       5172                  109
2016-07-01       4641                  110
2016-08-01       5052                  112

and so on till 2018.

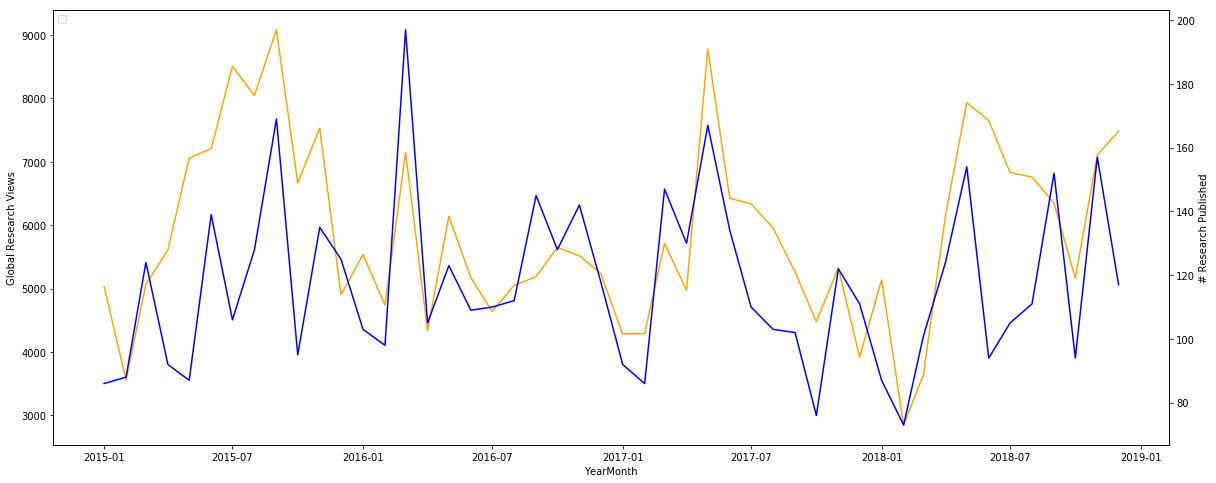
I want to find out how there two series are correlated/Cross Correlated and Causal? When I plot them I get to see this:

enter image description here

and as you can see that whenever the blue rises, the orange also rises, but in excel when i use correl function I get very low correlation, something like 0.20. Is there a better way of doing this? How can I find the true correlation? Kindly help.

$\endgroup$
1
  • $\begingroup$ With Mathematica's Correlation I get 0.52 for the data you posted. What do you get and could you post the whole data set? $\endgroup$
    – corey979
    Commented Feb 22, 2019 at 22:33

2 Answers 2

3
$\begingroup$

What IrishStat has described is theory. Here's what you can try to do (I have not checked but just giving a theoretical possibility):

You have an intuition that your series should have a higher correlation but excel is giving very low. As IrishStat has stated, for a non IID series/samples, the cross-correlation calculated will be biased. Now whether it will downward bias or upward, depends on the signs of the AR coefficients.

For example, say X and Y in true sense are not correlated. However, both X and Y series have +ve (but less than one, i.e. stationary) sign of AR coefficient(s) then it is very likely that X(t+1), X(t) will tend to move together. Same will be with Y(t) and Y(t+1). This can result in a positive correlation when it actually doesn't exist.

Similarly, if the signs are opposite, it will unnecessarily give a negative correlation. In your example, it could be that actually, correlation is high but the AR coefficients are opposite and dragging it down.

So how to do? Fit ARIMA to both the series. Extract error terms and then check correlation between them.

$\endgroup$
1
  • $\begingroup$ very nicely said ! $\endgroup$
    – IrishStat
    Commented Mar 12, 2019 at 21:12
1
$\begingroup$

The cross-correlation can be computed BUT it is another thing to test it's significance.

It is usually interpreted as if

  1. there no outliers in either series
  2. each series is normally distributed
  3. the correlation is invariant over time

It is important to know the assumptions underlying a statistical test or computation. Your attempt to interpret a value of.2 could be the result of one or more of these assumptions are violated by the data.

If either of these is not true then standard tests of significance will be flawed.

Extract from J.M. Potts (1991) Statistical methods for the comparison of spatial patterns in meteorological variables. Unpublished PhD thesis, University of Kent at Canterbury

[Suppose that X and Y are independent normal random variables. Then, in the absence of temporal autocorrelation, the correlation coefficient, r, between random samples of size n from X and Y has a probability density function f(r) = ((1 - r^2)^0.5(n-4)) / B(0.5,0.5(n-2)) The distribution has mean zero and a variance of (n-1)^-1. However, the distribution is affected by the autocorrelation in X and Y, which increases the variance of the distribution and so gives rise to spurious large correlations. This problem was recognised for time series as early as 1926 by Yule in his presidential address to the Royal Statistical Society. In the discussion of the address which followed, Edgeworth asked 'What about space ? Are there not nonsense correlations in space ?' (Yule, 1926). These questions are still being addressed by statisticians (and climate researchers !).]

Apparently the Google folks (and others !) are unaware of these caveats or at least don't mention them as they promote spurious statistics AFAIK .

https://www.searchenginejournal.com/google-correlate-research-tool/266341/

https://www.youtube.com/watch?v=DRM4ZXDFux8

Perhaps they should reread http://www.math.mcgill.ca/dstephens/OldCourses/204-2007/Handouts/Yule1926.pdf or https://www.jstor.org/stable/2341482?seq=1#page_scan_tab_contents

Since you have daily data there may be day-of-the-week-effects or month-of-the-year effects or holiday effects or day-of-the month effects et al . Only your data knows for sure and you should listen to it.

Most textbooks (if not all !) present correlation using data that is cross-sectional where that is no auto-correlation between successive values of X or Y without cautioning the reader/student in the explicit terms that I have used here.

$\endgroup$

Your Answer

By clicking “Post Your Answer”, you agree to our terms of service and acknowledge you have read our privacy policy.

Not the answer you're looking for? Browse other questions tagged or ask your own question.