I need some help in my forecasting analysis.
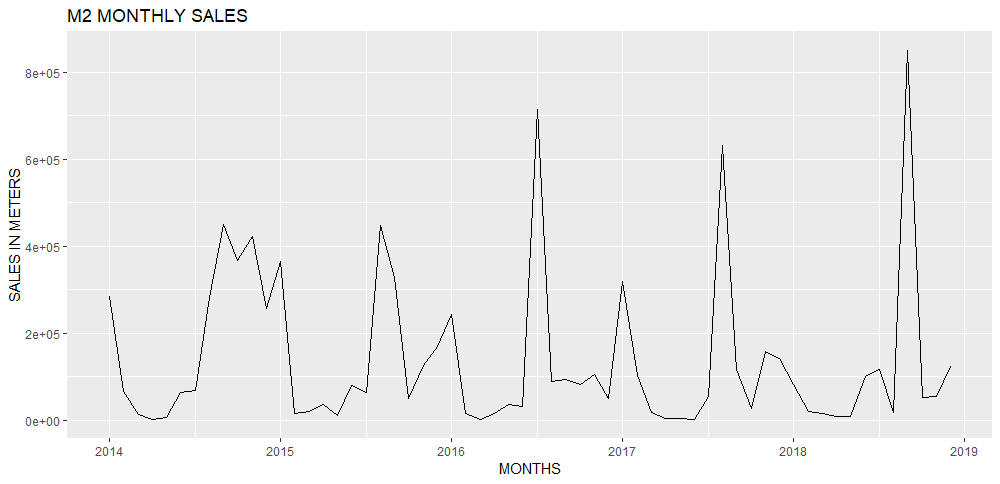
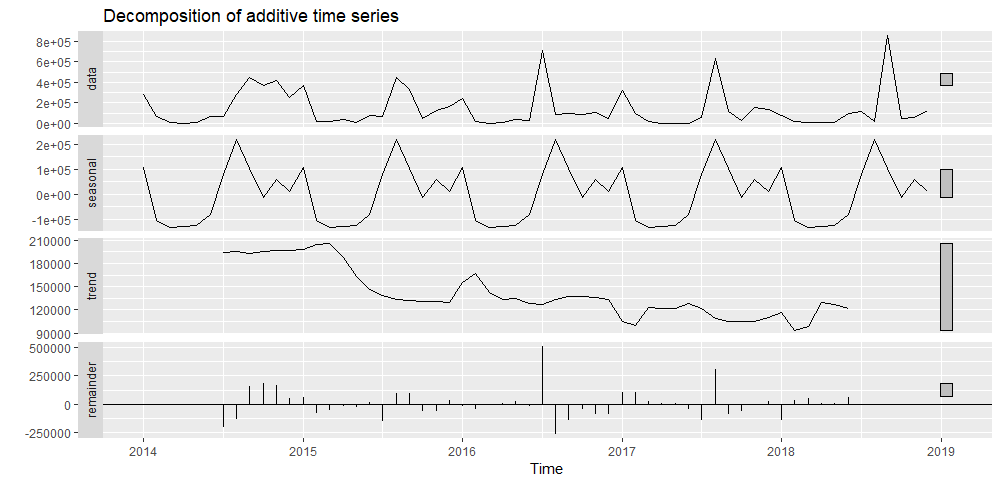
In my company, for the most part, if we take a look at monthly sales time series we will find a lot of noise, a large standard deviation and variance, very little seasonality and some trend series. As the product database that the company does planning is limited (between 5 and 4 years, up to 8 in some cases in older products) I can generate forecasts that are mostly very poor as if it were a forecast of white noise, with very few patterns and a very wide confidence interval. On the other hand I only need to analyze one point for the future or 2 at most.
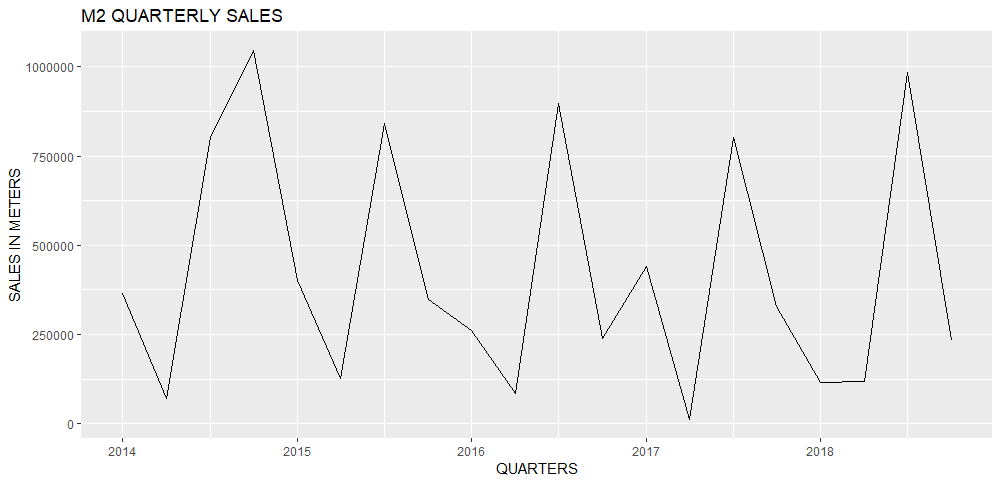
But going deeper into the study of the time series of my company's products I can see that if I aggregate the data quarterly and look at the series in this way, the coefficient of variation in all series falls by about half, and I can see more seasonal patterns! As my company has a demand that is much greater than supply and a lot of production inefficiency, we close orders that sometimes take almost three months to be done, forcing the client to buy with a space of two or 3 months! This makes the series have more noticeable seasonal peaks if we look at them on a quarterly basis).
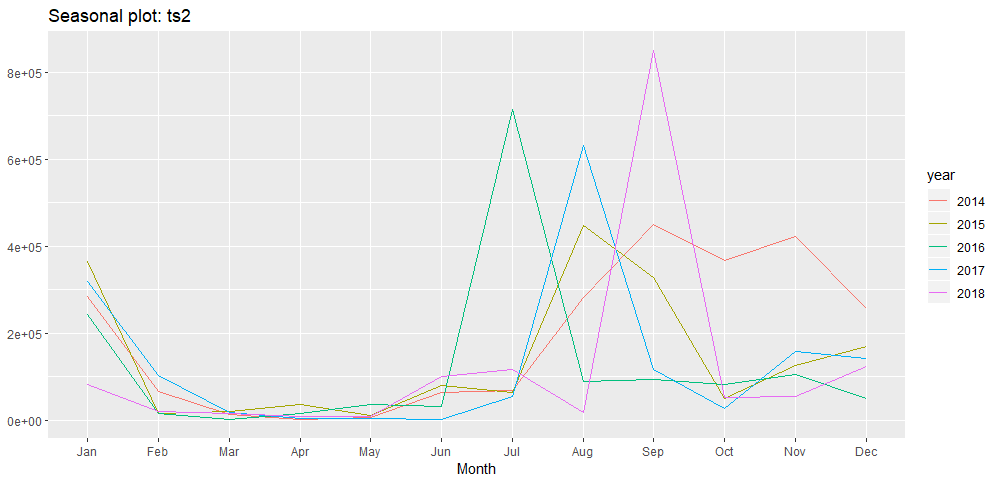
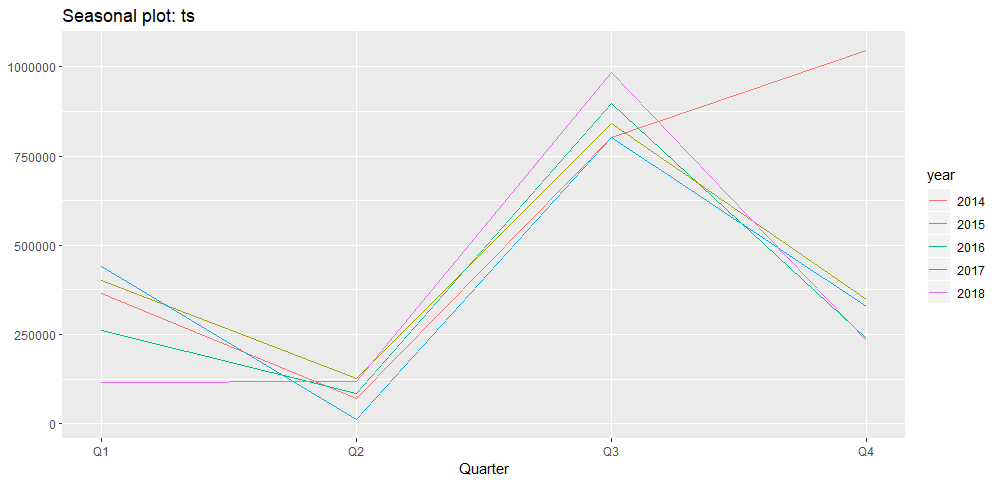
Example: We have a product with code M2, an article widely used as accessories for carnival party clothes. Carnival is a famous Brazilian festival that takes place between February and March. With this to carry out the whole process of making the clothes clients mostly make the purchase in the 3rd quarter of the previous year. If we look at the monthly data we cannot pick out the pattern very well, because it varies between the months of the third quarter (July, August and September).
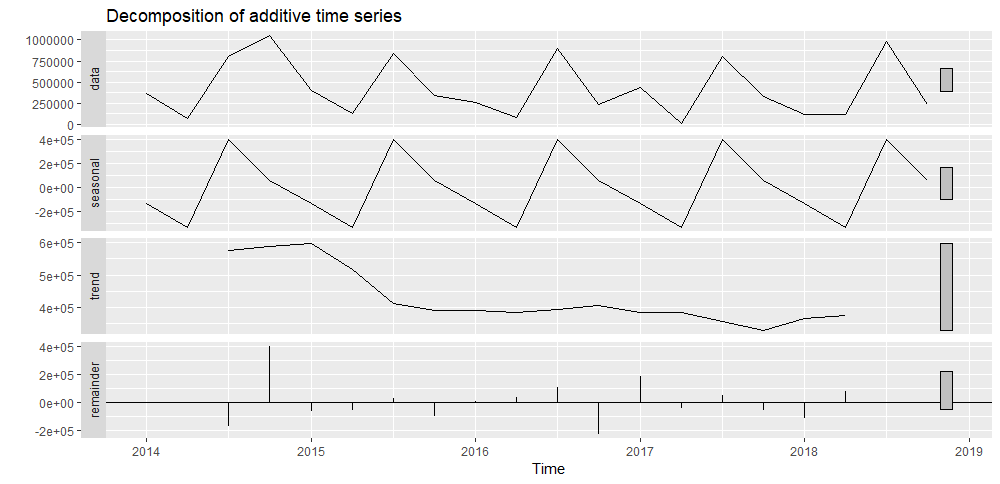
On the other hand, if we look at the data grouped quarterly, we can see a decrease in the data variation and the presence of a strong quarterly seasonal pattern: (Quarterly data for the first quarter of 2014 until the last quarter of 2018).
With the quarterly series I get better confidence intervals and capture more patterns in my series. But my doubt is that the company's S&OP routine needs this monthly. So far we are working with this quarterly forecast divided by 3 for each month of the quarter. We generated some errors in the month but in the quarterly accumulated we are close to what was predicted.
Is there any better way to make this monthly breakdown? Or given the limitations of data and because of the types of time series that I have is this the best tactic?

