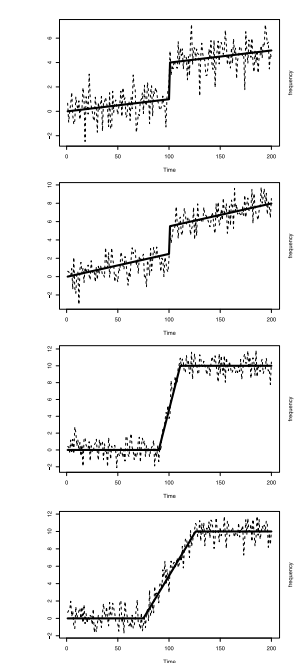
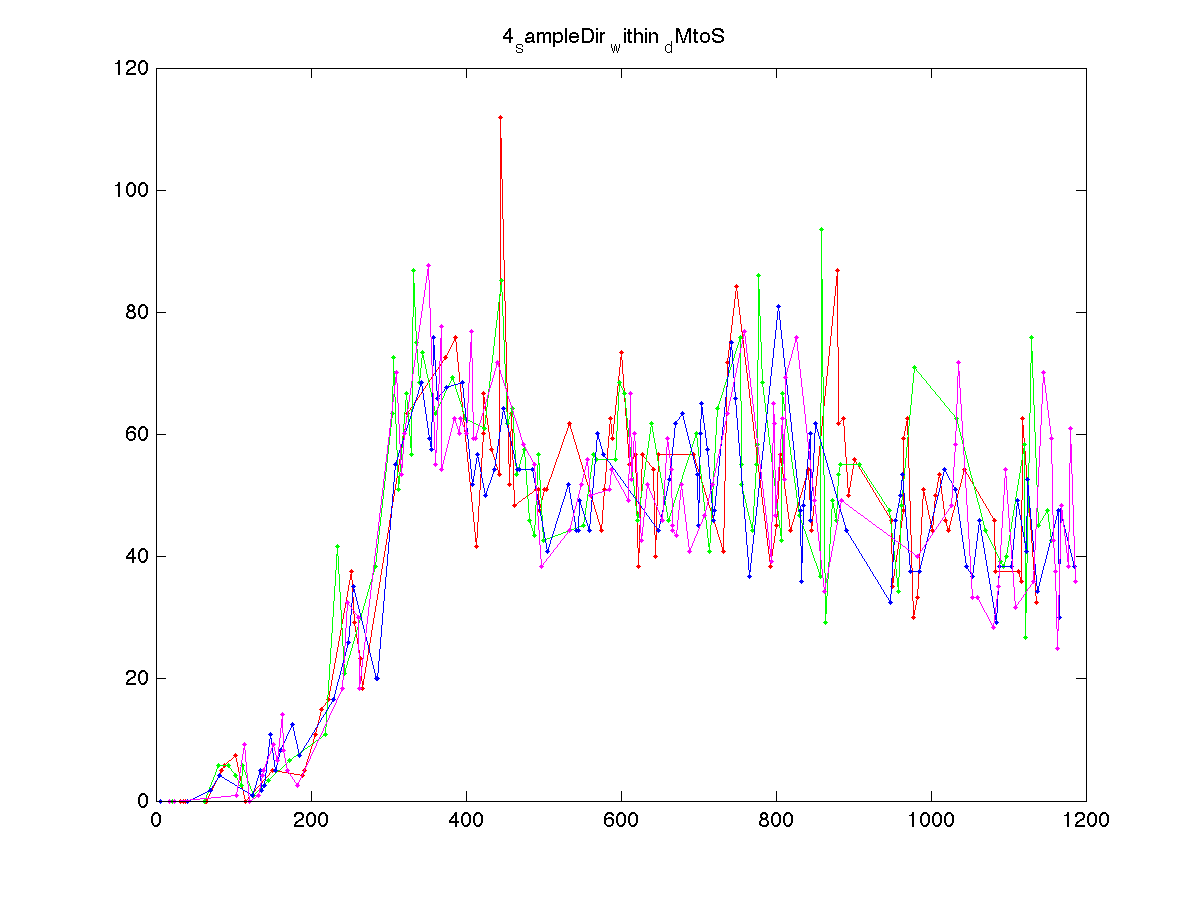
First, as I don't see any long stationary section on your data (the part "from 400 to 1200" is definitely not stationary) I have come to understood that what you do look for is for areas where the trend evolves in a similar way.
One way to so is by using a change point algorithm. One such algorithm can be found at P. Fryzlewicz, WILD BINARY SEGMENTATION FOR MULTIPLE CHANGE-POINT DETECTION (note there is a package called WBS available at CRAN)
Consider a simple model with change-points of the form
\begin{equation}
X_t = f_t + ε_t, \qquad t = 1, . . . , T,
\end{equation}
where $f_t$ is a deterministic, one-dimensional, piecewise-constant signal with
change-points whose number N and locations $η_1, . . . , η_N$ are unknown. The
sequence $ε_t$ is random and such that $\mathbb{E}(ε_t)$ is exactly or approximately zero. A suitable algorithm would estimate $N$ and $η_1, . . . , η_N$ under various assumptions on $N$, the magnitudes of the jumps and the minimum
permitted distance between the change-point locations.
So WBS works this way:
In the first stage we randomly draw a number of subsamples i.e.
vectors $(X_s, X_{s+1}, . . . , X_e)$, where $s$ and $e$ are integers
such that $1 ≤ s < e ≤ T$, and compute the CUSUM statistic on each
subsample. We then maximise each CUSUM, choose the largest maximiser
over the entire collection of CUSUMs, and take it to be the first
change-point candidate to be tested against a certain threshold. If it
is considered to be significant, the same procedure is then repeated
recursively to the left and to the right of it. The hope is that even
a relatively small number of random draws will contain a particularly
‘favourable’ draw in which, for example, the randomly drawn interval
$(s, e)$ contains only one change-point, sufficiently separated from
both $s$ and $e$: a set-up in which our CUSUM estimator of the
change-point location works particularly well as it coincides with the
maximum likelihood estimator (in the case of $ε_t$ being i.i.d.
Gaussian). We provide a lower bound for the number of draws that
guarantees such favourable draws with a high probability. Apart from
the threshold-based stopping criterion for WBS, we also introduce
another, based on what we call the strengthened Schwarz information
criterion.
And that is a practical example

However note, the assumptions of the algorithm might not be satisfied by your data (especially the constant Gaussian variance of the error term). Hence, you may want to stabilize the variance first for more efficient estimation of the change-points.


