2
$\begingroup$

Okay, on my AP Statistics test on the chapter on significance tests, the following free response question appeared:

When the manufacturing process is working properly, NeverREady batteries have lifetimes that follow a slightly right-skewed distribution with μ = 7 hours. A quality control supervisor selects the simple random sample of n batteries every hour and measures the lifetime of each. If she is convinced that the mean lifetime of all batteries produced that hour is less than 7 hours at the 5% significance level, then all of those batteries are discarded.

(b) Since testing the lifetime of a battery requires draining the battery completely, the supervisor wants to sample as few batteries as possible from each hour's production. She is considering a sample size of n = 4. Explain why this sample size may lead to problems in carrying out the significance test of (a).

Now, (a) was just defining the parameter of interest (μ = the true mean lifetime (in hours) of NeverReady batteries) and labeling the null (μ = 7) & alternative (μ < 7) hypotheses.

I answered that it would result in a lower power of the significance test.

Now, why was this the incorrect answer?

Is it because it was already stated above that the population distribution was slightly right skewed and therefore not Normal?

In addition, when I searched the question up online and I found 3 answer keys with the answer to the problem: 2 of them state it's because of the lower power, and 1 of them states that its because the population distribution is neither large (n = 4 < 30) nor Normal (because its slightly right-skewed).

Which one is right? Is it the Normal/Large Sample condition or is it the lower power that may cause problems when doing a significance test? I'm assuming the former but only 1/3 answer keys would have the correct answer in that case. It seems to me that both answers are problems a small sample size would have on a significance test.

$\endgroup$
2
  • $\begingroup$ The last sentence of your 2nd paragraph seems to end abruptly. I assume you meant something like "...all of those batteries are destroyed." // Nice question. Hope you enjoy your AP Statistics class. $\endgroup$
    – BruceET
    Commented Mar 10, 2019 at 8:46
  • $\begingroup$ @BruceET Yeah, it should have ended with "are discarded." $\endgroup$ Commented Mar 10, 2019 at 15:57

1 Answer 1

1
$\begingroup$

Typically, decreased sample sizes result in poorer power, whatever then concerns about the population distribution.

For example, suppose we know the population of batteries is normal. We don't know the mean $\mu$ for a particular batch, but past experience has shown that the population standard deviation is about $\sigma = 3.$

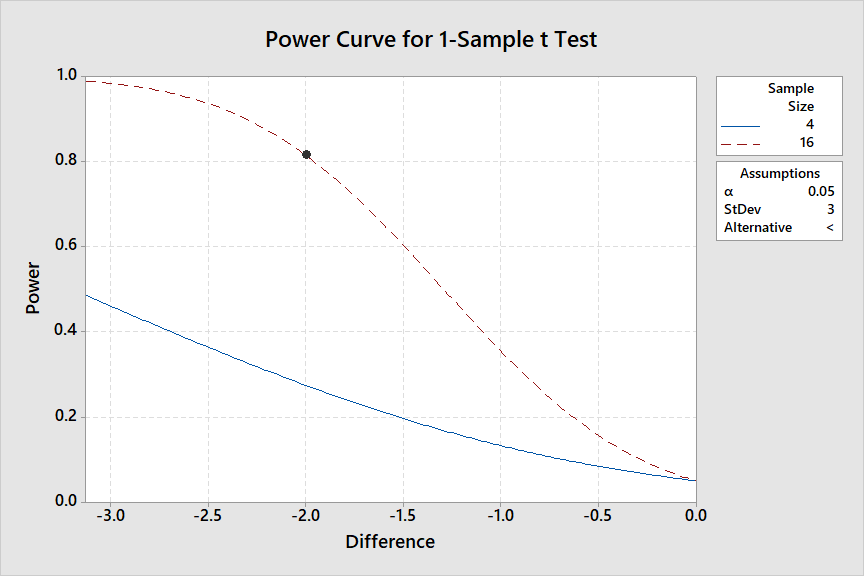
We are testing $H_0: \mu = 7$ against alternative $H_a: \mu < 7$ at the 5% level, using a one-sample t test. We would be disappointed not to be able to detect a $\mu$ value as small as $5$ with probability 80%. That is, we want power $0.8.$

The following chart from Minitab, shows that a sample of size $n = 16$ (upper curve) would be large enough to get the desired power, but a sample of size $n = 4$ (lower curve) would not. On the chart, we want the value $-2$ on the horizontal axis, because $7 - 2 = 5.$

enter image description here

Also, if the population is slightly skewed to the right then $n = 4$ may be too few observations for the t test used above to give truthful results. The $T$ test statistic is not distributed even roughly according to Student's t distribution with $n - 1$ degrees of freedom, unless the sample mean is roughly normal.

Just as one possible illustration, the histogram on the left shows individual samples from a right-skewed population. The one in the middle shows of averages of $n = 4$ observations; it is still noticeably skewed. By contrast, the histogram on the right shows a more nearly normal distribution of averages of $n = 40$ observations. (The Central Limit Theorem has performed as promised.)

enter image description here

So I would say that both objections to a sample of size $n = 4$ seem correct---both poor power and skewed distribution.

$\endgroup$

Your Answer

By clicking “Post Your Answer”, you agree to our terms of service and acknowledge you have read our privacy policy.

Not the answer you're looking for? Browse other questions tagged or ask your own question.