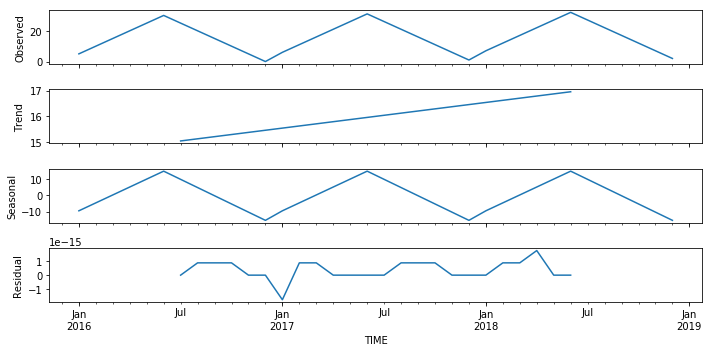
Made up data:
TIME    VALUE
2016-01 5
2016-02 10
2016-03 15
2016-04 20
2016-05 25
2016-06 30
2016-07 25
2016-08 20
2016-09 15
2016-10 10
2016-11 5
2016-12 0
....
2018-01 7
2018-02 12
2018-03 17
2018-04 22
2018-05 27
2018-06 32
2018-07 27
2018-08 22
2018-09 17
2018-10 12
2018-11 7
2018-12 2
Logic Used: Jan = 5, Increase by 5 till June, Decrease by 5 after that. Next year, add 1 to each value.
Run Additive time series decomposition
from statsmodels.tsa.seasonal import seasonal_decompose
plt.rcParams['figure.figsize'] = [10, 5]
result = seasonal_decompose(df, model='addictive',freq = 12)
result.plot()
plt.show()
Maybe this is due to my limited statistical knowledge, but I was expecting that the trend component would simply be 0,1,2 and seasonal component would be 2016 values. However as can be seen from graph, the trend component starts from 15, which has been subtracted from seasonal component. Any guidance on this would be really helpful. Maybe I am completely wrong here and deploying wrong statistical method?

