3
$\begingroup$

Can anyone please explain how splitting is performed in regression trees when we only have continuous features. I have referred to different papers, but all I could find is formulas or theorems.

Can someone please explain, with an example, how we can build a regression tree from scratch?

That would be a great help.

$\endgroup$
2
  • $\begingroup$ Suppose someone offers you a salary of $x$-dollars. You decide either to take the job, or not. For example, if the salary offers so few dollars that you cannot live on it, and you have no other income, you would likely not take it. That is a decision. $\endgroup$
    – Carl
    Commented May 8, 2019 at 5:46
  • $\begingroup$ This is just the concept. I am in search the mathematics behind, i.e how we find the best node to split among rest , how we calculate the squared loss, to identify the root node $\endgroup$
    – Sim
    Commented May 8, 2019 at 11:19

4 Answers 4

1
$\begingroup$

Tree-based models perform recursive binary splits to optimize some metric, like information gain or Gini impurity. If you have continuous variables, then at each step, the algorithm will look for the variable/cutoff combination that is 'best' according to the metric used. In case of a discrete outcome variable, this relates to the number of correctly classified outcomes. In case of a continuous outcome, then this could for example be the split that reduces the residual variance the most.

If you have a mixture of discrete and continuous variables, then the algorithm works no different:

  • Either split a continuous variable at some optimal threshold
  • Or split a categorical variable based on the category that results in the largest improvement

If you really want to understand how the tree 'comes to its decision' at each step, you should study the metric used for splitting.


Edit: An example procedure using MSE

  1. Define a loss function $\sum_{i=1}^{k}\sum_{j=1}^{n_i}{(\hat{y}_j - y_j)^2}$, where $k$ is the current number of nodes (start at $k=1$) and $n_i$ is the number of observations in node $i$;
  2. Define some regression model. This could be just an intercept, like in André's example: $y = \beta_0 + \epsilon$, or it could include explanatory variables that you don't want to split, but rather regress on, at the terminal nodes;
  3. Use an optimizer (e.g. the default in R's optim) to minimize the loss function in (1) by considering splits among all variables. To do this, you need to obtain all $\hat{y}$ values by running your regression model from (2) on each terminal node's observations;
  4. Repeat (3) until some criterium has been reached (e.g. the number of observations in each node is less than can be further split, given the number of parameters in (2));
  5. You now have a full tree that you can prune.

Your model in (2) can be all kinds of things. For example, R's party package can do simple linear regression, survival analysis, multivariate regression and more. If you want more specific details, try reading the vignette. Section 3.2 explains splitting criteria.

$\endgroup$
9
  • $\begingroup$ Thanks @Frans Rodenburg , but how to decide the optimal threshold for splitting and how to choose the very first root node. $\endgroup$
    – Sim
    Commented May 8, 2019 at 3:38
  • $\begingroup$ That depends on the metric. In case of Gini impurity, choose whatever cutoff for any of the input variables results in the smallest chance to incorrectly classify an observation. That will be your first node. Then just keep repeating the process. See here for example: victorzhou.com/blog/gini-impurity $\endgroup$ Commented May 8, 2019 at 3:45
  • $\begingroup$ for Regression task, where we have continus values like , eg. say Salary 100,200,400,500,800,1000,4889,6890 and many more other features with these kind of values. how Ginni can be calculated for this. $\endgroup$
    – Sim
    Commented May 8, 2019 at 4:22
  • $\begingroup$ as per my knowledge, Ginni and Entropy are done for classification problem. $\endgroup$
    – Sim
    Commented May 8, 2019 at 4:24
  • $\begingroup$ Exactly, so you would use a different metric, such as squared loss. $\endgroup$ Commented May 8, 2019 at 4:25
1
$\begingroup$

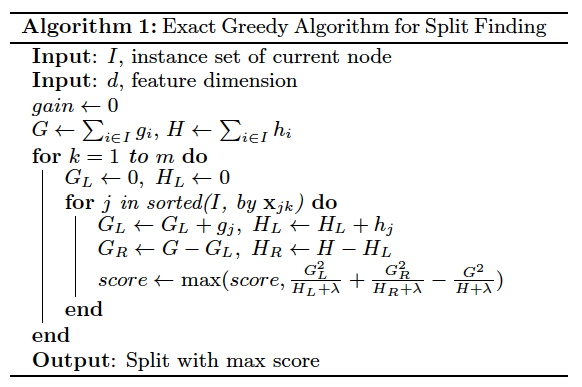
Chen and Guestrin (2016) review common split finding algorithms. A simple one is the exact greedy algorithm:

Exact Greedy Algorithm

Derivatives definition

And $l$ is a loss function.

Since the exact greedy algorithm is computationally intensive, GBM packages use approximations. You can find approximate algorithms in papers or in code repositories. LightGBM has a very readable code base. Their implementation of split finding is available here:

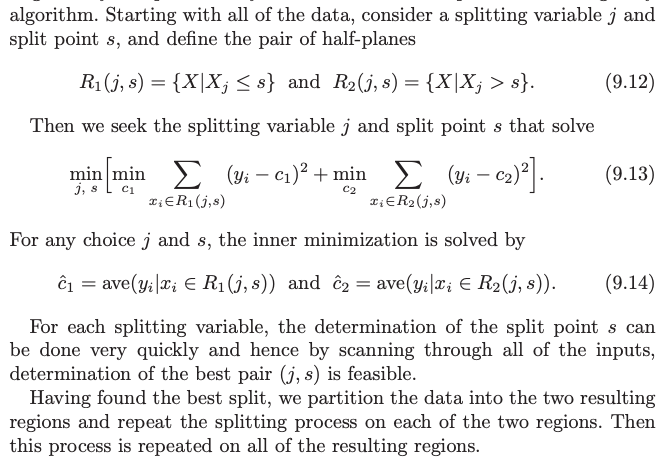
If you are interested in a more human-friendly explanation, The Elements of Statistical Learning describes regression trees in Chapter 9 (page 307 in 12th printing):

enter image description here

$\endgroup$
0
$\begingroup$

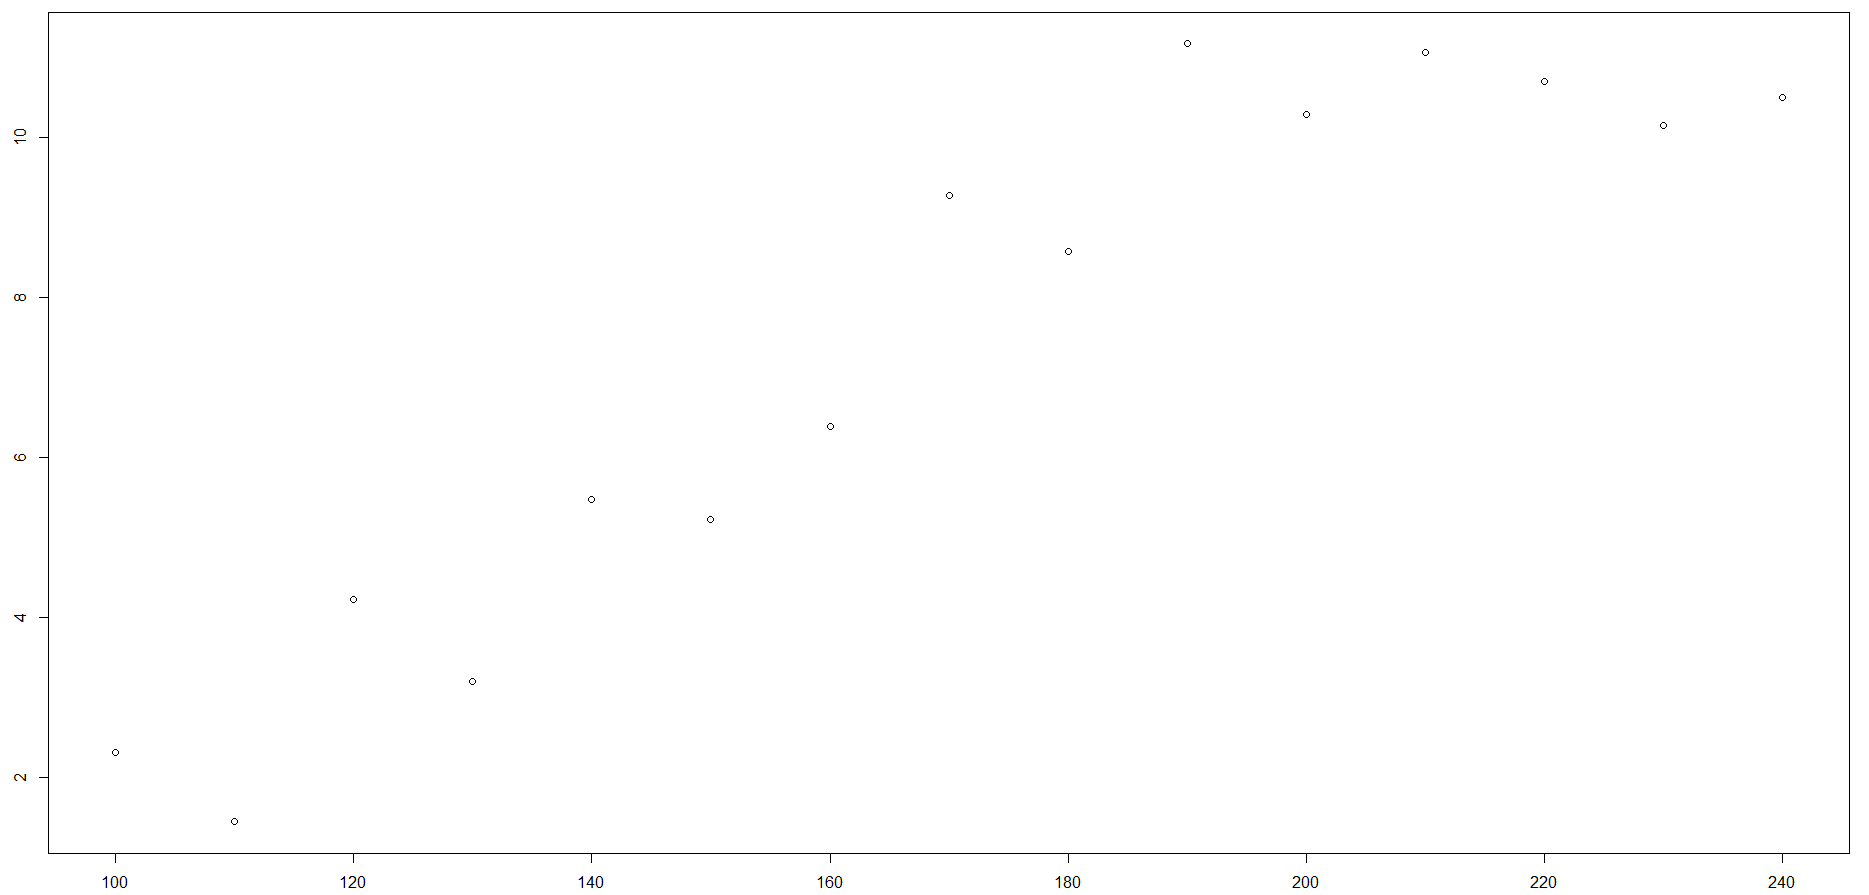
If you consider the case of a single continuous covariate and continuous response we can visualise it like this:

enter image description here

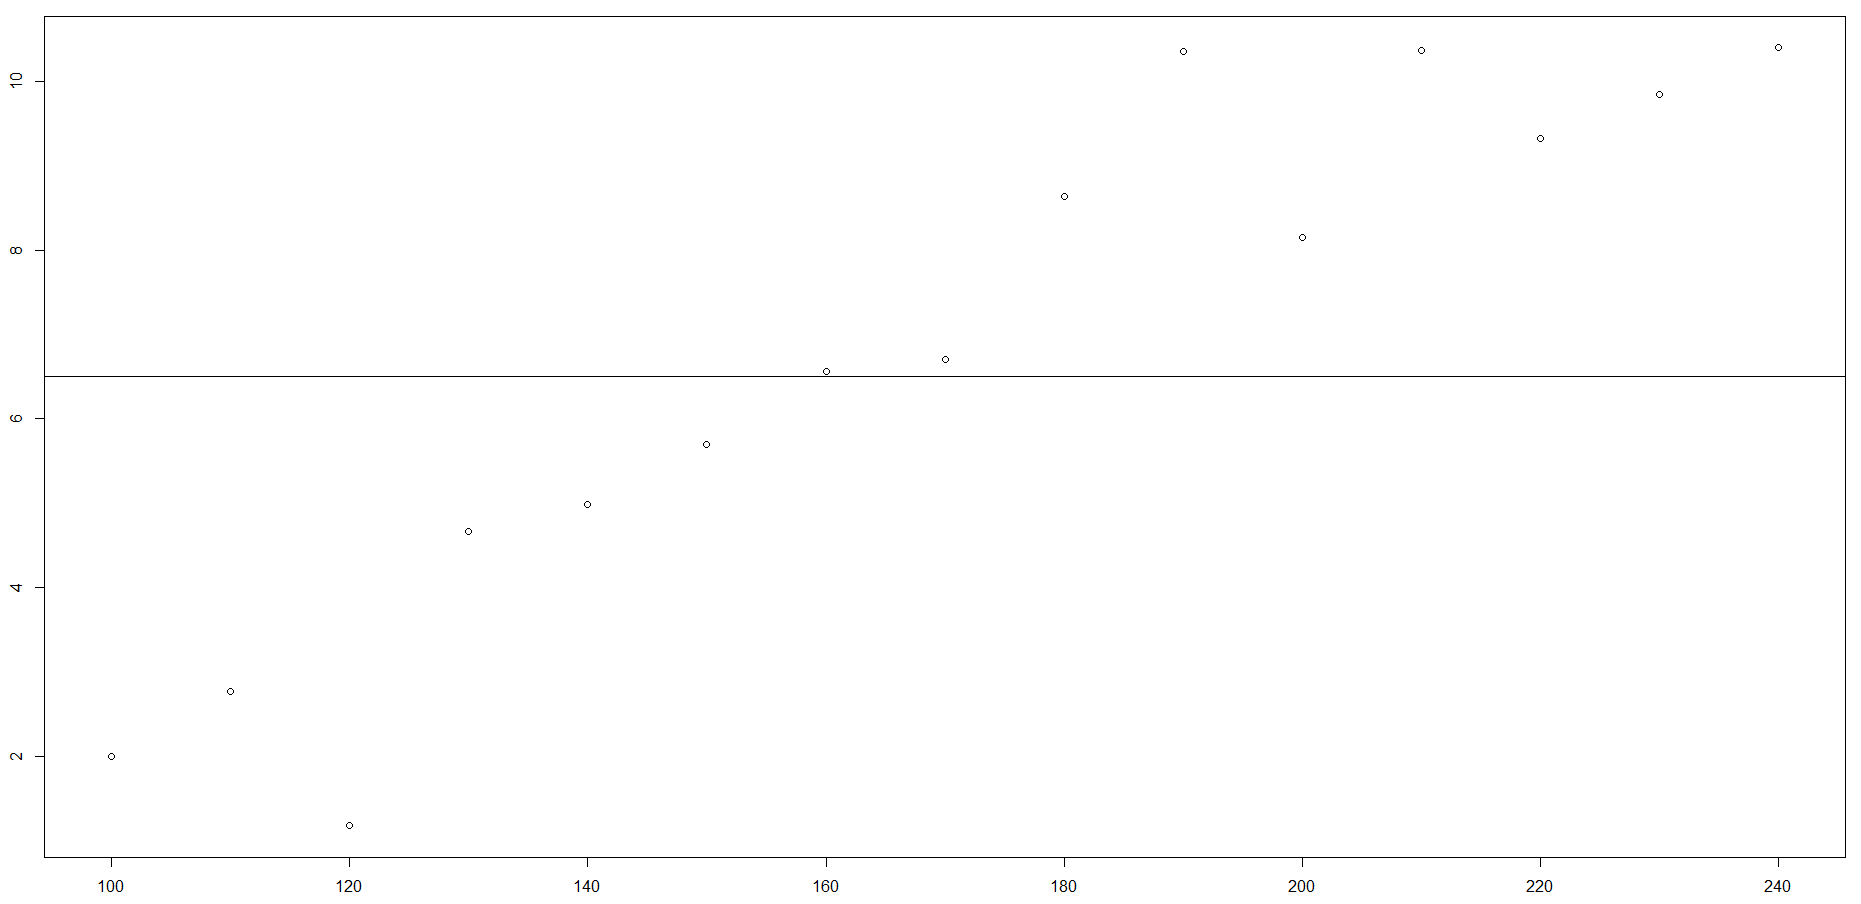
To begin with the tree would fit a straight regression line with no covariates, just an intercept (i.e. response ~ 1), which would look something like this:

enter image description here

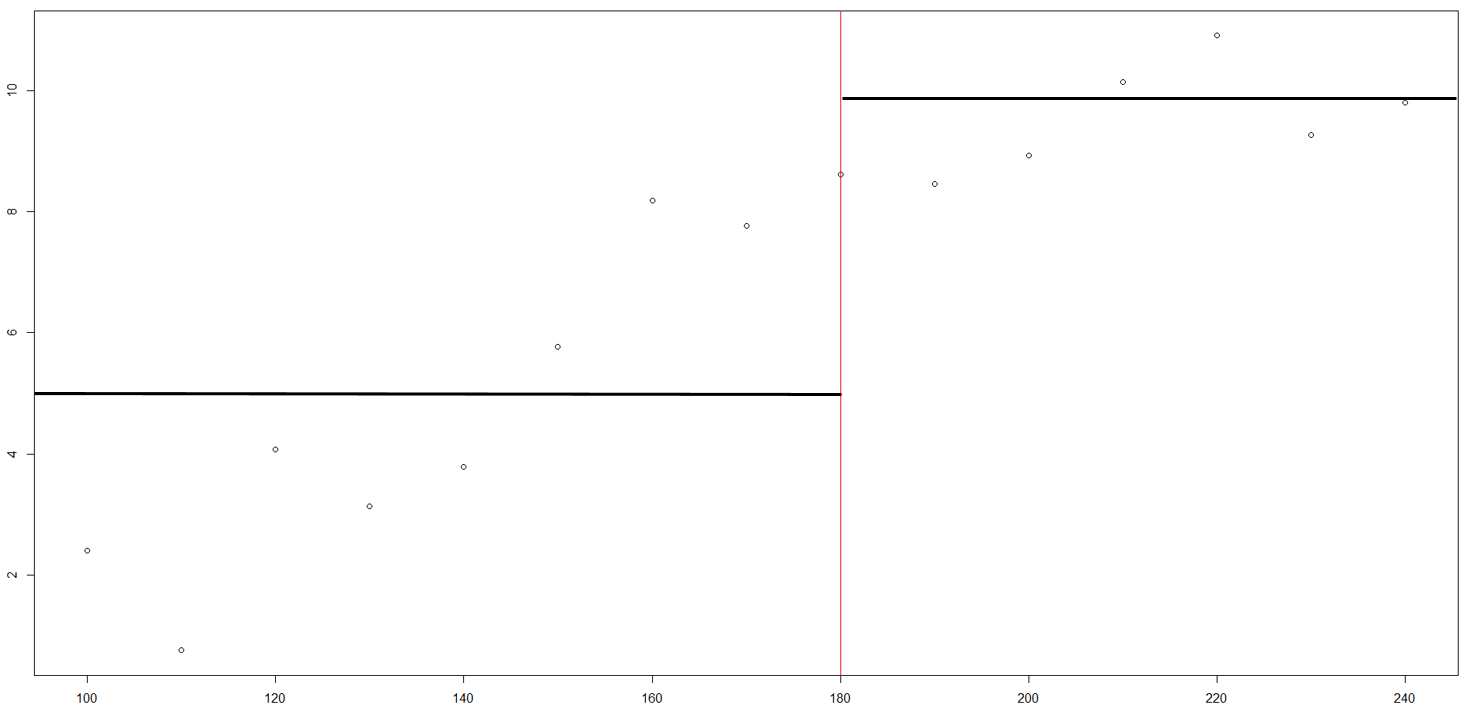
and compute some measure of error. These can be things like Gini impurity, mean square error (MSE), etc. from this line. Lets run with MSE. It would then assess where it could partition the data into two to achieve the greatest reduction in overall MSE. You can see there is a break around 180 where the relationship asymptotes. So the tree would split the data here, and fit a separate regression to each of the two new regions.

enter image description here

It would continue making these binary splits along the covariate until a split would no longer produce a drop in MSE > than some predefined value. In the case of multiple covariates it does the same thing but instead considers multiple variables and chooses a single covariate to split the data cloud on based on it providing the greatest reduction in MSE. This allows different variables to be used at different points, but the partitioning of the data cloud remains the same in principle.

$\endgroup$
2
  • $\begingroup$ Hi André.B. Thanks for the response.. Can you please give a detailed explanation, or an example, from which i can learn (1) how to choose the splitting node , what calculations are needed which help in choosing the root node (2) And then further procedure of splitting the nodes.. I all so confused in the derivations and theorems explaining this concept.. and still not able to create a Regression tree.. If you can guide me. $\endgroup$
    – Sim
    Commented May 8, 2019 at 5:25
  • $\begingroup$ (1) The root node and all subsequent child (or splitting) nodes are chosen on the basis of the algorithm you use. In the case of mean square error see this link: medium.freecodecamp.org/…. To fit a regression tree I would use the rpart R package. here is a tutorial on fitting them in R: statmethods.net/advstats/cart.html $\endgroup$
    – André.B
    Commented May 9, 2019 at 3:47
0
$\begingroup$

Suppose your tree is splitting some continuous variable $x.$ In your data, you have $M$ observations, each with a specific value for this particular column, that already falls into the given branch before splitting, i.e. $\{x_1, x_2, \dots, x_M\}$. Note, that $M$ isn't necessarily the original size of the data, because this may be one of many splits that have already occurred, and not all the data necessarily falls into the branch where this new split is taking place.

For the $M$ points, after the split they will take on values $\{ \hat{y_1}, \dots, \hat{y_M} \}$, each of which will be one of two possible values: $w$ or $z$. We'll say that $\hat{y_i} = w$ if $x_i < \lambda$, and $\hat{y}_i = z$ otherwise. Thus $x = \lambda$ is the splitting point.

Suppose you are trying to minimize some loss function, $L(\textbf{y}, \hat{\textbf{y}}) = \sum_i l(y_i, \hat{y_i}).$ This may be the sum of squared error, the cross-entropy, or something else depending on whether you're doing regression, classification, etc. For example, if your loss function is the sum of square error (assuming you're doing regression), the post-branch value of your loss function for all $M$ values in the current branch is:

$$ L = \sum_{x_i < \lambda} \left ( y_i - w \right)^2 + \sum_{x_i \ge \lambda} \left(y_i - z \right)^2. $$ The goal is to minimize this with repsect to $\lambda$, $w$, and $z$ simultaneously.

It's not easy to see how to minimize this right off the bat, because it's a discontinuous function with respect to $\lambda$ (changing it changes which $x$'s are in each region). For a given $w$ and $z$, $L$ is a piecewise flat function of $\lambda$. That is, if there are no values in the observation set between $x_k$ and $x_l$, then $L$ is a constant in $[x_k, x_l).$ Thus, for convenience, $\lambda$ can be taken to be any one of points in the observed values $\{x_1, \dots, x_M \},$ because any slight shift in $\lambda$ that doesn't change the region distribution of the $x$'s will not change $L$. It's easy to see that, for a given value of $\lambda$, the optimal values of $w$ and $z$ are the means of the $y$ values in each respective region. Thus, to optimize $w, z, \lambda$, we can simply run $\lambda$ through all values in $\{x_1, \dots, x_M\}$, assigning $w$ and $z$ to the appropriate means in each case, and evaluate $L$. We choose the values that minimizes $L.$

This tells you how to find a branching point for a given feature $x$. However, at each branch, you want to minimize not only the branching point and values of each branch, but the variable that you want to branch. Since the minimization for each variable is a quick process, it suffices to do the minimization for all variables (or all of them in the subset being considered, if you're subsampling the columns to avoid overfitting), then pick the one that gives the best minimization (biggest decrease in loss function).

$\endgroup$

Your Answer

By clicking “Post Your Answer”, you agree to our terms of service and acknowledge you have read our privacy policy.

Not the answer you're looking for? Browse other questions tagged or ask your own question.