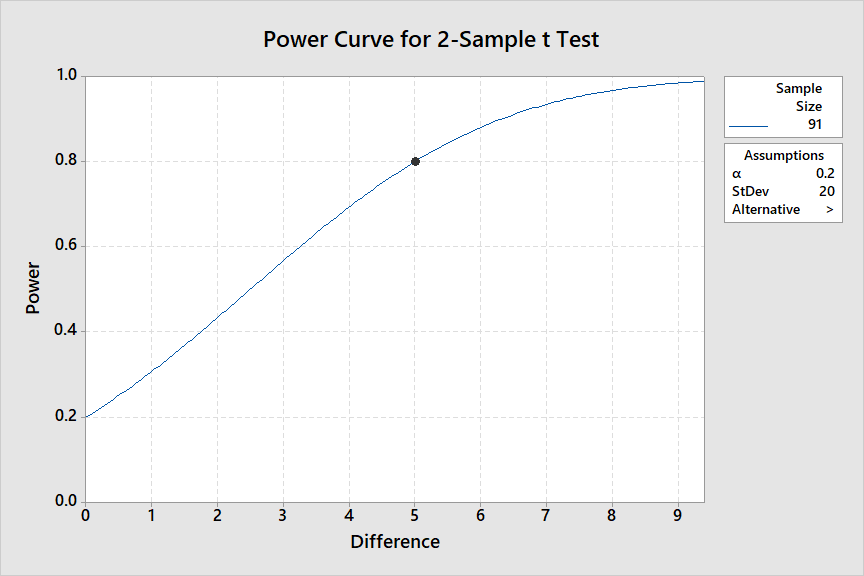
Apparently, you are doing a two-sample pooled t test of $H_0: \mu_1 = \mu_2$ vs $H_a: \mu_1 > \mu_2$ at the 20% level of significance and wishing to detect a difference of $\delta = 5$ thousand with power 80%, where the standard deviations of the two independent groups are each $\sigma = 20$ thousand. You found that a sample size if $n = 91$ is required.
Here is output from Minitab statistical software confirming this result:
Power and Sample Size

2-Sample t Test

Testing mean 1 = mean 2 (versus >)
Calculating power for mean 1 = mean 2 + difference
α = 0.2
Assumed standard deviation = 20

            Sample  Target
Difference    Size   Power  Actual Power
         5      91     0.8      0.800402

The sample size is for each group.
As this output says, you would need 91 days in each group (91 in the treatment group and 91 in the control group, for a total of 182 days of observations).

Notes: (1) The ratio $\delta/\sigma = 5/20 = 0.25$
is crucial to this computation.
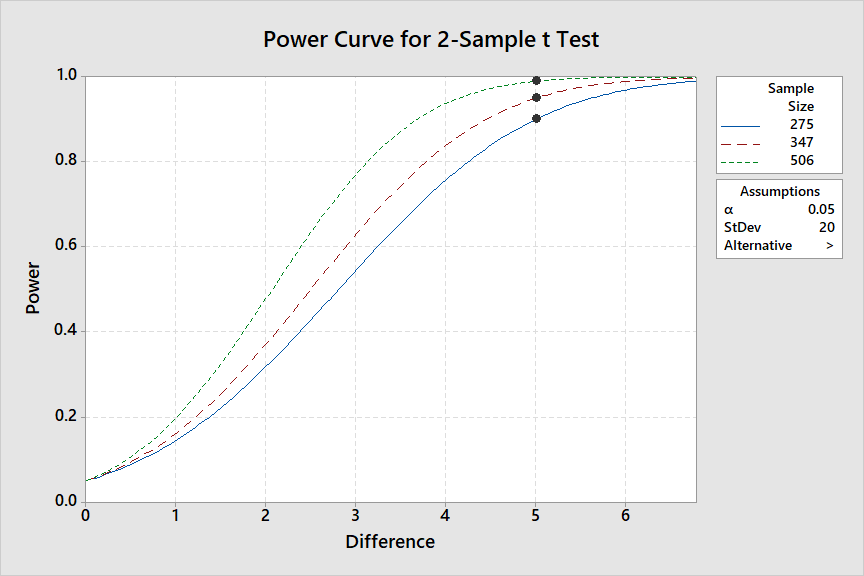
(2) The desired error probabilities are also crucial: if you want 5% and 95%, then the sample size required in each group increases to $n=347.$
Power and Sample Size

2-Sample t Test

Testing mean 1 = mean 2 (versus >)
Calculating power for mean 1 = mean 2 + difference
α = 0.05
Assumed standard deviation = 20


            Sample  Target
Difference    Size   Power  Actual Power
         5     275    0.90      0.900260
         5     347    0.95      0.950006
         5     506    0.99      0.990070

 The sample size is for each group.


