1
$\begingroup$

I have 3 stores differentiated by the StoreID, and I would like to predict the total sales across stores for the next month. I receive the Early Report of the sale as indicated by the ERSales column. This data comes in far ahead of the actual sales number. What I would like to do is predict an individual store's Sales for the next month based on their early report (the actual Sales and ER Sales are usually about the same as you can see by the UnitDiff column, but sometimes there is just bad bad or customer returns, etc.), and forecast a total sales number across all stores, which updates when I receive a new ERSales number for a store. Any suggestions or articles about how to approach the problem would be greatly appreciated.

| Month | StoreID | Sales | 3MMAvg | ERSales | 3MMAvgER | UnitDiff | AvgDiff |
|-----------|---------|-------|--------|---------|----------|----------|---------|
| 10/1/2018 | 64 | 20 | 20.33 | 14 | 14.67 | 6 | 5.67 |
| 11/1/2018 | 64 | 9 | 15.00 | 10 | 12.67 | -1 | 2.33 |
| 12/1/2018 | 64 | 15 | 14.67 | 14 | 12.67 | 1 | 2.00 |
| 1/1/2019 | 64 | 37 | 20.33 | 35 | 19.67 | 2 | 0.67 |
| 2/1/2019 | 64 | 33 | 28.33 | 41 | 30.00 | -8 | -1.67 |
| 3/1/2019 | 64 | 34 | 34.67 | 31 | 35.67 | 3 | -1.00 |
| 4/1/2019 | 64 | 24 | 30.33 | 23 | 31.67 | 1 | -1.33 |
| 10/1/2018 | 143 | 19 | 29.67 | 20 | 29.00 | -1 | 0.67 |
| 11/1/2018 | 143 | 33 | 28.33 | 34 | 29.00 | -1 | -0.67 |
| 12/1/2018 | 143 | 11 | 21.00 | 12 | 22.00 | -1 | -1.00 |
| 1/1/2019 | 143 | 24 | 22.67 | 26 | 24.00 | -2 | -1.33 |
| 2/1/2019 | 143 | 22 | 19.00 | 24 | 20.67 | -2 | -1.67 |
| 3/1/2019 | 143 | 33 | 26.33 | 33 | 27.67 | 0 | -1.33 |
| 4/1/2019 | 143 | 29 | 28.00 | 28 | 28.33 | 1 | -0.33 |
| 10/1/2018 | 181 | 9 | 21.67 | 11 | 18.00 | -2 | 3.67 |
| 11/1/2018 | 181 | 18 | 16.00 | 13 | 12.33 | 5 | 3.67 |
| 12/1/2018 | 181 | 23 | 16.67 | 4 | 9.33 | 19 | 7.33 |
| 1/1/2019 | 181 | 5 | 15.33 | 9 | 8.67 | -4 | 6.67 |
| 2/1/2019 | 181 | 9 | 12.33 | 10 | 7.67 | -1 | 4.67 |
| 3/1/2019 | 181 | 10 | 8.00 | 17 | 12.00 | -7 | -4.00 |
| 4/1/2019 | 181 | 16 | 11.67 | 27 | 18.00 | -11 | -6.33 |
$\endgroup$
5
  • $\begingroup$ I was wondering ... Was my answer helpful to you or do you have a remaining question ? $\endgroup$
    – IrishStat
    Commented Jun 11, 2019 at 21:08
  • $\begingroup$ Yes I think so. Using Autobox really is not feasible for me, but I think a similar approach in R would be to use the auto.arima with xreg from the forecast package if I am not mistaken? $\endgroup$
    – user250123
    Commented Jun 12, 2019 at 13:40
  • $\begingroup$ auto.arima believes the data . It doesn't challenge it for distortions brought by UNUSUAL X's or Y's thus you could be mistaken as it's approach is flawed as was pointed out by @AdamO "The correlogram should be calculated from residuals using a model that controls for intervention administration, otherwise the intervention effects are taken to be Gaussian noise, underestimating the actual auto-regressive effect." If your data is as trivial as your example 1 then you are good to go BUT if not then not-so-much . If my answer was helpful then upvote it , accept it and close the question $\endgroup$
    – IrishStat
    Commented Jun 12, 2019 at 14:00
  • $\begingroup$ Is there an existing R approach which does account for distortions? $\endgroup$
    – user250123
    Commented Jun 12, 2019 at 14:15
  • $\begingroup$ Only in the pre-specification of the ARIMA model and a hard specification that only the contemporaneous X is needed. $\endgroup$
    – IrishStat
    Commented Jun 12, 2019 at 14:52

1 Answer 1

0
$\begingroup$

Your solution is an extension of ordinary regression to deal with time series complications/opportunities that might be present in the data. In general it is called SARMAX https://autobox.com/pdfs/SARMAX.pdf. I took the first store (#64) as an example . You don't need the 3 averages or the difference between sales and ersales as these are derived series while original/pure information is in the observed data series ( sales and ersales (EST) ). The derived (descriptive) series often if not always muddy the water and are usually counter-productive . The role of modelling is to evolve what combination of observed data is important/significant .

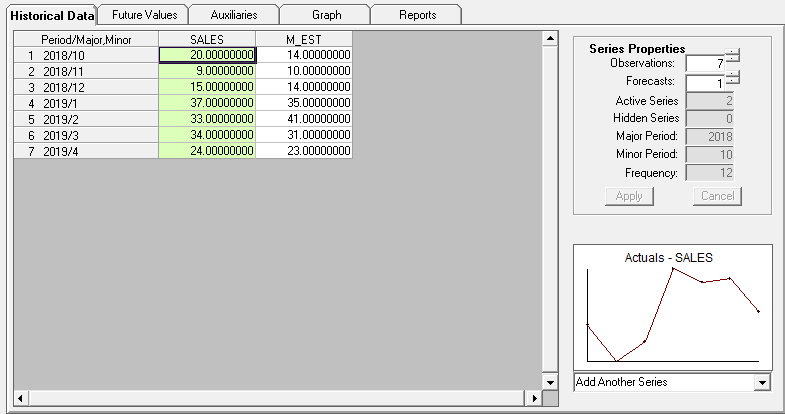
The data for the observed is here enter image description here and I specified 25 as the ersales (EST in the output ) for next month to illustrate the approach. enter image description here

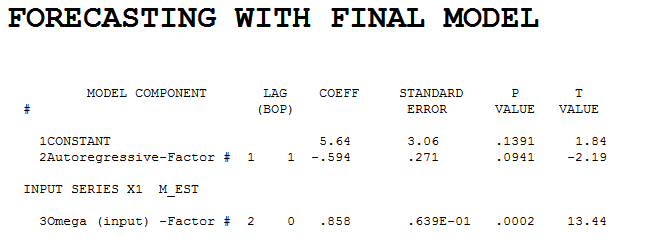
The model building exercise suggested no anomalies or any other deterministic structure and a memory scheme suggesting that sales should be predicted from last month's sales , current ersales and last month's ersales. enter image description here and here enter image description here

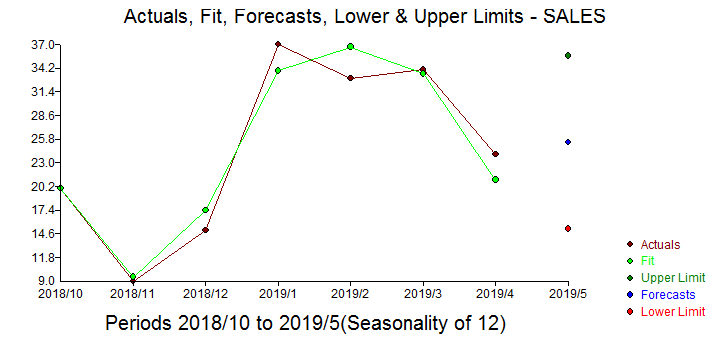
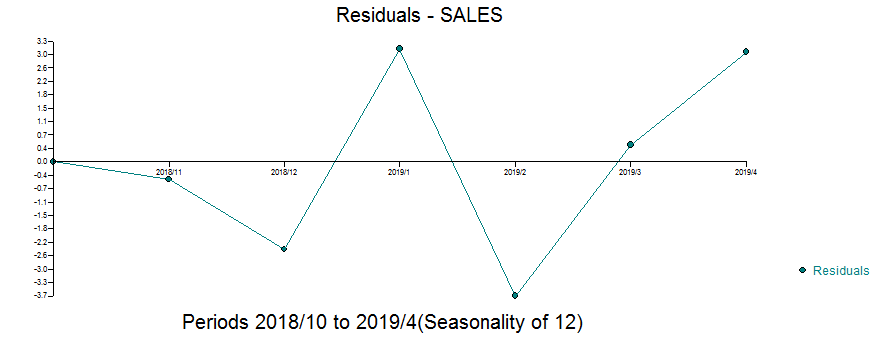
THe Actual,Fit and Forecast is presented here enter image description here with model residuals plotted here suggesting sufficiency enter image description here

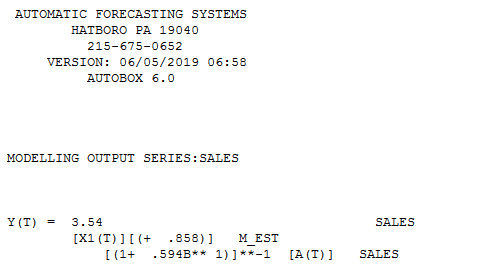
All SARMAX models can be presented as expanded regression models as here enter image description here showing details as to how the forecast is computed.

Things can get a little bit more complicated when you have pulses , level/step shifts , seasonal pulses and or local time trends BUT not to worry software and methodology exists to help you. https://autobox.com/pdfs/A.pdf provides a general approach which you can follow.

To generalize this in order to have 1 equation for all stores is probably not a good idea as the form of the response of actual sales to ersales is usually going to differ across stores. If one has longer series it is often possible to pull out/identify seasonal factors and use user-suggested series such as population or average price as they may play a role.

There are a few questions on SE that might help you The theory behind fitting an ARIMAX model and Forecasts based on other forecasts

Finally https://autobox.com/pdfs/regvsbox-old.pdf is a walk through as to how ordinary regression grows into a Transfer Function (ARMAX) when time or space is in play.

With respect to tour mission of predicting sales across ALL stores , I would develop individual store-level forecasts using the simulation option in AUTOBOX to make probabilistic/boot-strapped confidence intervals for the forecast AND then using monte-carlo resample those individual forecast values for each of the stores AND sum them to get an estimate of the composite. The distribution of those forecasts can then lead to probabilistic statements about the company as a whole. See Why does my ARMA forecast get smaller over time? for a discussion about developing probability distributions for forecasts that are free of distributional assumptions.

Hope all of this helps you .

$\endgroup$

Your Answer

By clicking “Post Your Answer”, you agree to our terms of service and acknowledge you have read our privacy policy.

Not the answer you're looking for? Browse other questions tagged or ask your own question.