I have 1800 units and I know the probability of failing for each unit every week for 2000 weeks.
I would like to obtain some failure times for each unit. One way to do this could be to use a binomial distribution.
Something like (for each unit)
rbinom(2000, 1, vector_of_probabilities)
#0,0,0,0,0,...,1,0,0,0,...,1,0,0,0
We can then classify the failure time as the week with the first 1 obtained from the sequence of random binomial (well, Bernoulli really) (0,1) values.
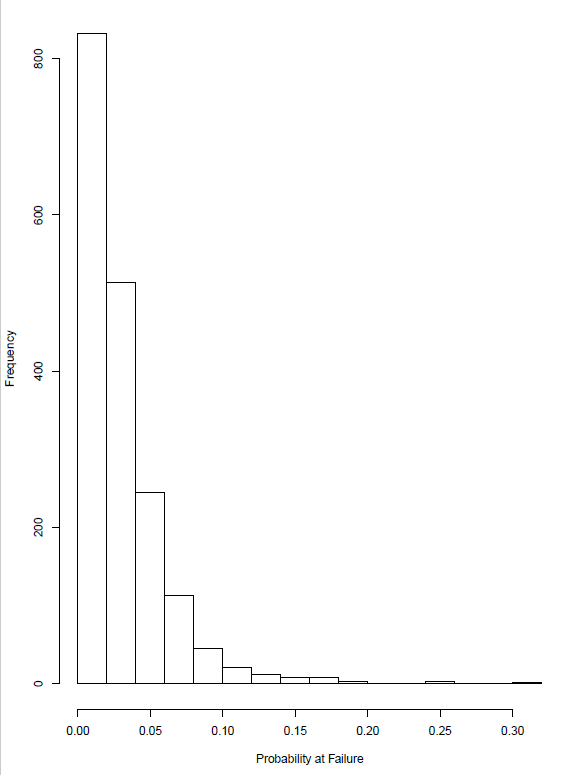
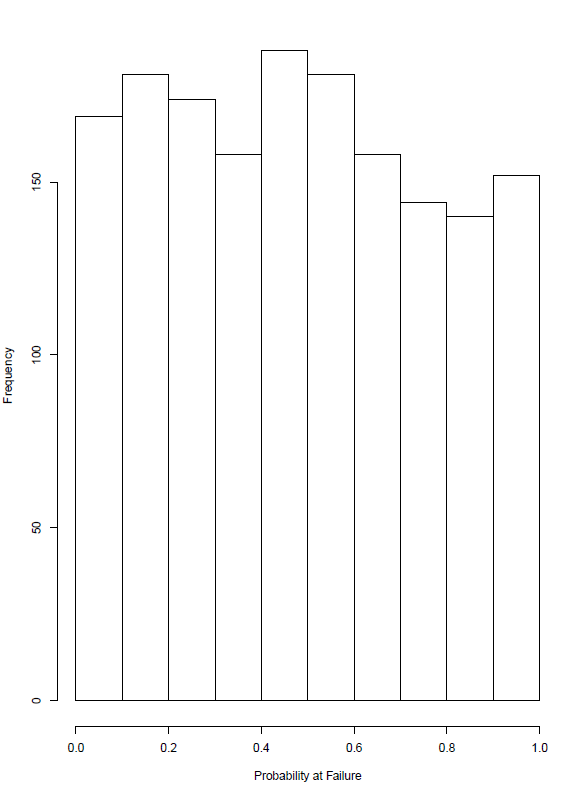
However, I find that most units fail when their probability of failing is quite low. I have attached a plot which shows the probability of failure at the time of failing, for each unit.
My understanding of this is explained with a small example:
Suppose I have N = 2000 units, and the probability of failure at each week is the same for each unit. For this example, let us assume that we know the probability of failure for 1000 weeks.
s = seq(0.001, 1, by = 0.001)
I.e. the probability of failing in week 1 for each unit is 0.001, the probability of failing in week 2 for each unit is 0.002, etc.
Using the binomial distribution at each week, I expect: $0.001 \times 2000 = 2$ units to fail in week 1, $0.002 \times 1998 = 3.996$ units to fail at week 2, ...
Using the following code
s = seq(0.001, 1, by = 0.001)

u = c()
u[1] = 2000

for(i in 1:length(s)){

  u[i+1]= u[i] - s[i]*u[i]

}
where u shows the number of units still working at time $t$, with $u[1]$ being the number of units working at time 0, etc; we find $u[101] = 10.72607$, i.e. we expect around 1990 units to have failed by this point. But, the value of $s[101] = 0.101$.
My conclusion is that the binomial distribution is not useful for generating failure times, given the probability of failure at different time points. The reasoning being that most units will fail whilst the probability of failure is "quite low". Is there anything else that I could do to generate some failure times? Perhaps something that generates around p% of units to have failed when s = p, and not a cumulative number of failures like the Binomial distribution gives.
Edit: One solution could be to view the probabilities of failing for each unit as a degradation path (which goes from 0 to 1). At time $t=0$ the degradation for each unit is zero. A unit could then be classified as failing when the degradation path (or equivalently the probability of failing) reaches a threshold $D_f$.
It would be interesting to hear other ideas on how to generate the failure times.


