0
$\begingroup$

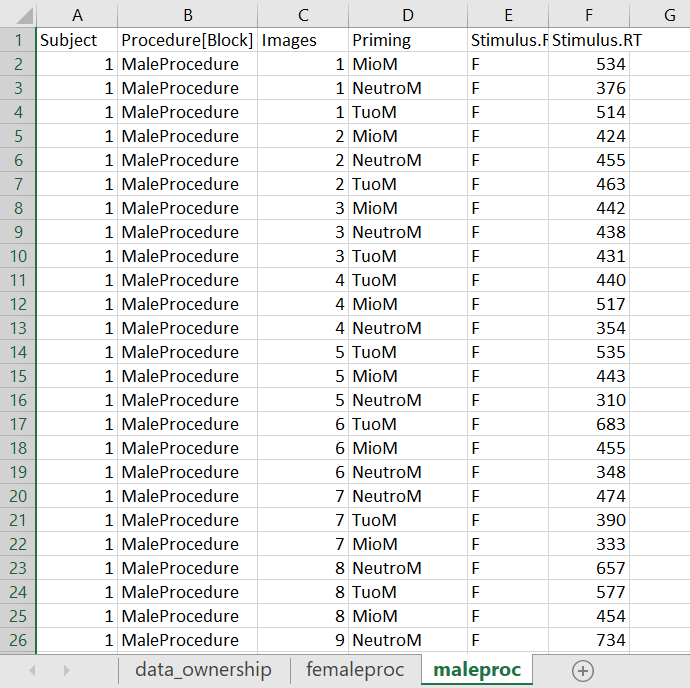
I have the following dataset

enter image description here

I would like to calculate the frequency distribution of the response F or G in each participant, for each condition (MIO,TUO, NEUTRO) for a total of 15 images representing 15 distances, do I have to perform a logistic model? Does someone know how to implement it in R, or in SPSS? and how I should frame the data?

$\endgroup$
5
  • $\begingroup$ I guess you need to go with ANOVA: stats.stackexchange.com/questions/340129/… (probit link) $\endgroup$ Commented Oct 5, 2019 at 8:40
  • $\begingroup$ Can you give more context? What does your variables represent? You say response F or G ..., but we see only F in the table, and the column name is Stimulus.F , not response ... $\endgroup$ Commented Oct 5, 2019 at 16:25
  • $\begingroup$ Ok. F and G mean yes or not, here you can see just F, but if I scroll down there are some G as well. The column Stimulus means "Stimulus Response". Basically participants see 15 images about 15 distances for each priming (MIO, TUO, NEUTRO), and they have to decide subjectively whether the distance is "Near" YES=G OR NOT=F. $\endgroup$
    – chiara
    Commented Oct 6, 2019 at 18:40
  • $\begingroup$ I have to calculate a probability threshold that signals the passage from F to G $\endgroup$
    – chiara
    Commented Oct 6, 2019 at 18:51
  • $\begingroup$ RTs add information about the time to take the decision to respond, so they are informative of the uncertainty in giving the response. $\endgroup$
    – chiara
    Commented Oct 6, 2019 at 18:55

0

Your Answer

By clicking “Post Your Answer”, you agree to our terms of service and acknowledge you have read our privacy policy.

Browse other questions tagged or ask your own question.