4
$\begingroup$

To determine organic carbon concentrations in a water solution from UV spectroscopy I made a calibration curve with known carbon concentrations and measured the UV absorbance. I used R for the data analysis and the data are found below.

My question now is, how to determine the accuracy of my calibration curve. I would like to tell people that I can measure the concentrations with an accuracy of 15% or 4 mg l-1, for example. How can I go on with this? Can I just use the $R^2$ (0.91) and say that I have an uncertainty of 9% (1-0.91)? What is the correct way to do this?

concentration <- c(27.2,32.4,16.5,11.6,11.9,9.87,46.0,73.6,75.4,73.1,59.5,49.0,
            79.0,81.6,66.7,26.7)

absorbance <- c(0.764, 0.923, 0.678, 0.373, 0.287, 0.253, 1.660, 2.331, 2.255, 
            2.019, 1.130, 1.858, 2.404, 2.812, 2.362, 0.636)

plot(absorbance, concentration, xlab = "absorbance (254 nm)", ylab = "concentration (mg l-1)")

fit <- lm(concentration ~ absorbance)
abline(fit)
lm_coef <- round(coef(fit), 3) # extract coefficients
myr2 <- format(summary(fit)$adj.r.squared, digits = 2)
legend("topleft", legend = as.expression(c(bquote(paste("lin. equation: ",
                                                    y == .(lm_coef[2])*x + .(lm_coef[1]))), 
                                       bquote(paste("", R^2 == .(myr2))))), cex = 0.6)
$\endgroup$

1 Answer 1

4
$\begingroup$

You should be aware that with calibration your independent variable is the concentration of your standards and the dependent variable is the measured quantity.

Look at package chemCal for some nice functions.

concentration <- c(27.2,32.4,16.5,11.6,11.9,9.87,46.0,73.6,75.4,73.1,59.5,49.0,
                   79.0,81.6,66.7,26.7)

absorbance <- c(0.764, 0.923, 0.678, 0.373, 0.287, 0.253, 1.660, 2.331, 2.255, 
                2.019, 1.130, 1.858, 2.404, 2.812, 2.362, 0.636)


library(chemCal)

#fit a linear model
fit <- lm(absorbance~concentration)

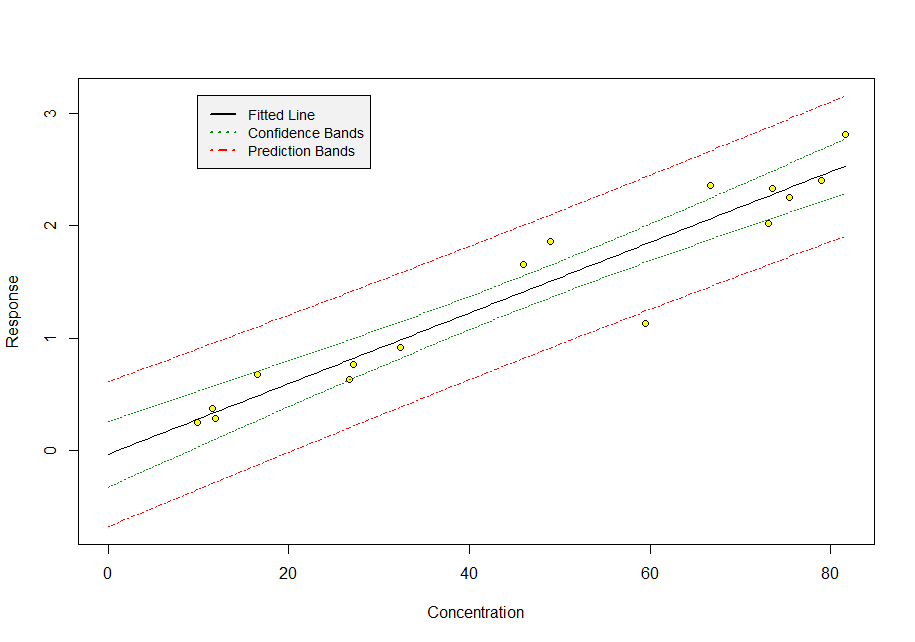
#plot with confidence and prediction bands
calplot(fit)

calibration plot

#limit of detection:
lod(fit)

$concentration
[1] 32.48287

$absorbance
        1 
0.9895864 

#limit of quantification:
loq(fit)

$concentration
[1] 56.84455

$absorbance
       1 
1.753749 

#calculate concentration from given absorbance of 1.5
inverse.predict(fit,1.5)

$Prediction
[1] 48.75498

$`Standard Error`
[1] 8.79395

$Confidence
[1] 18.86115

$`Confidence Limits`
[1] 29.89384 67.61613

Reading the help files and references therein might be instructive.

$\endgroup$

Your Answer

By clicking “Post Your Answer”, you agree to our terms of service and acknowledge you have read our privacy policy.

Not the answer you're looking for? Browse other questions tagged or ask your own question.