4
$\begingroup$

I'm trying to use the sobol2007 model in the R sensitivity package. I'm doing runs on a model with 26 parameters, and using 2 sets of 500 monte-carlo samples to seed the analysis, and nboot=500. This results in 14k runs

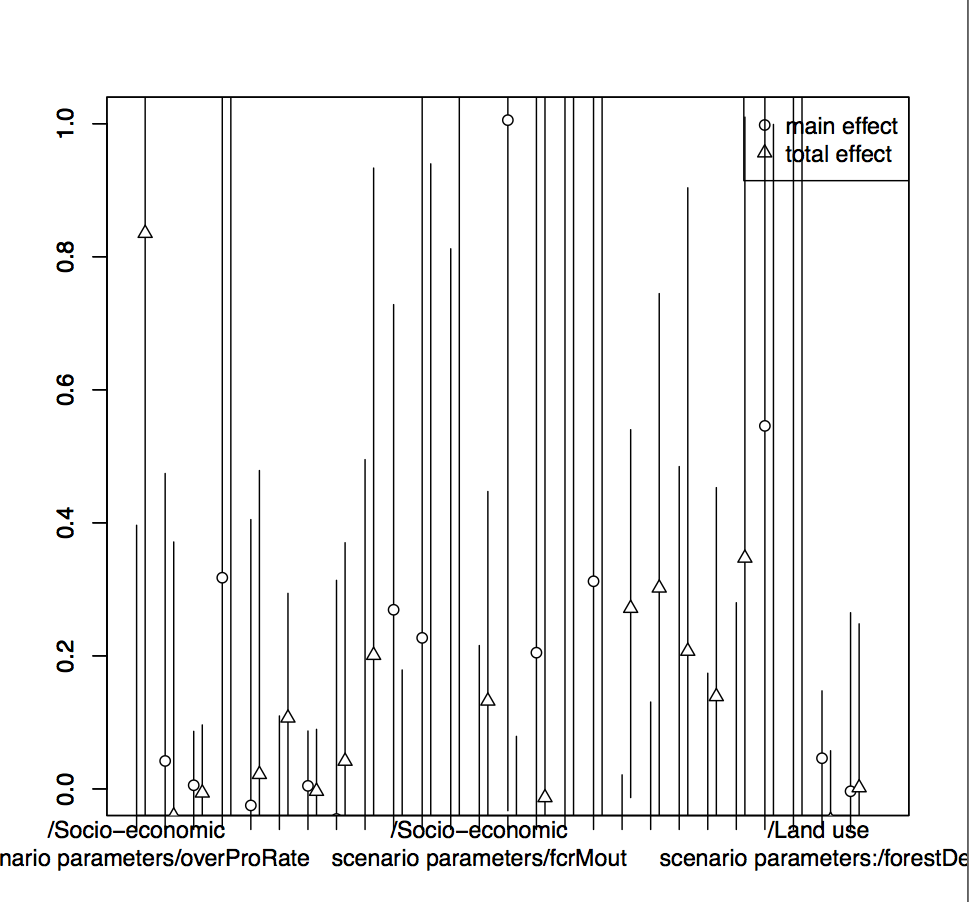
When I generate the sensitivity results, I'm expecting numbers in 0..1, but I get both * negative numbers * very high numbers (e.g. 10)

When I plot the model, I can see that the confidence intervals are gigantic: Sobol sensitivity model output
It feels like 14k runs should be reasonable to estimate this number of parameters, but maybe I'm being overly optimistic.

Can anyone answer:

  • am I totally unrealistic, and/or how many runs should I be using?
  • can I read anything from these outputs, or are they essentially so noisy as to be worthless?
  • how should I be selecting nboot - there's no guidance in the docs?
$\endgroup$
2
  • $\begingroup$ The sample size seems very small for Sobol... Something in the four of five digits might help. $\endgroup$
    – Pascal
    Commented Oct 13, 2016 at 14:58
  • $\begingroup$ For the bootstrap, I think you might get away with 100. $\endgroup$
    – Pascal
    Commented Oct 13, 2016 at 15:01

2 Answers 2

6
$\begingroup$

Sobol sensitivity indices do not require zero mean function but estimation formulae are not robust at all. To avoid this kind of problem, a new formula has just been coded in the version 1.6 of the sensitivity package: soboljansen()

$\endgroup$
2
$\begingroup$

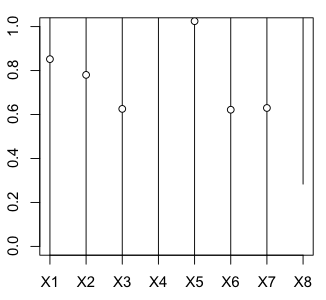
It looks like the sobol sensitivity model requires zero-mean data to function:

X1 <- data.frame(matrix(runif(8 * n), nrow = n))
X2 <- data.frame(matrix(runif(8 * n), nrow = n)) #Random samples
x <- sobol(model = NULL, X1 = X1, X2 = X2, order = 1, nboot = 100) #Create model, first order only
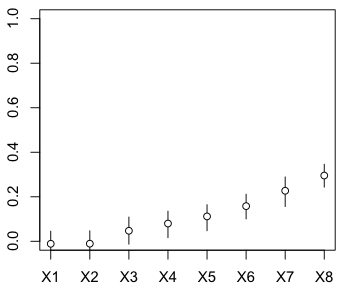
r <- as.matrix(x$X,ncol=8) %*% c(1,2,3,4,5,6,7,8); #Response is proportional to factor number
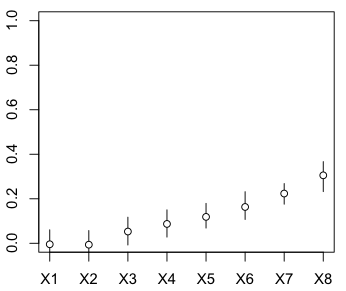
tell( x, (r-mean(r))/sd(r) ); plot(x) #Standardised

Standardised response

tell( x, r-mean(r) ); plot(x) #Zero mean

Zero mean

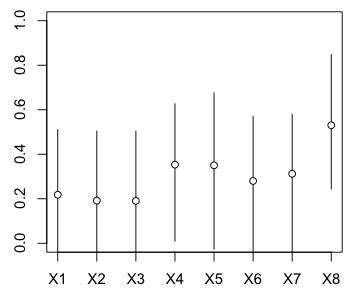
tell( x, r ); plot(x) #Unprocessed

Unprocessed

tell( x, r*1000 ); plot(x) #Scaled

Scaled

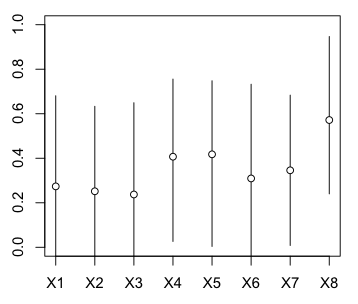
tell( x, r+40 ); plot(x) #Offset

Offset

So altogether it looks like scaling doesn't make much difference, but a non-zero mean throws it off completely.

$\endgroup$

Your Answer

By clicking “Post Your Answer”, you agree to our terms of service and acknowledge you have read our privacy policy.

Not the answer you're looking for? Browse other questions tagged or ask your own question.