2
$\begingroup$

I have a regression model of y = a + b * x and both variables are continuous. I've found that the coefficient of x, which is b, is statistically significant in the regression y = a + b*x.

Now I want to test whether the coefficients of x will be different for small and large values of x if I partition x into two groups (small vs. large). For example, how can I test whether b1 and b2 are statistically different?

y1 = a1 + b1 * x, for x < a cutoff value of x (small values of x)

y2 = a2 + b2 * x, for x >= a cutoff value of x (large values of x)

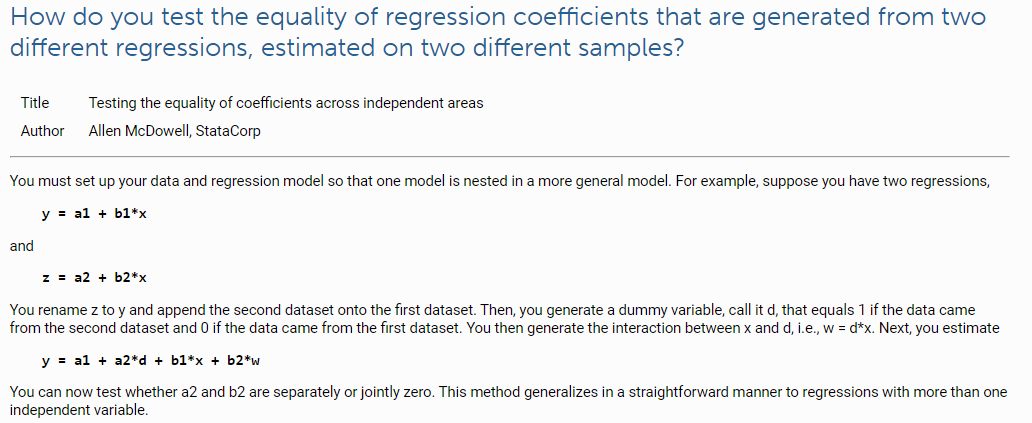
I found the method discussed in the Stata FAQs can be helpful https://www.stata.com/support/faqs/statistics/test-equality-of-coefficients/

enter image description here

However, I am not sure if it is OK that my y and z are essentially the same variable, i.e. y1 for small values of x and y2 for large values of x.

Also, one answer to the question How to compare two regression slopes for one predictor on two different outcomes? said the dependent variables in the method above, namely y and z, need to be independent. If it is true, how can I test my y1 and y2 are independent from each other?

$\endgroup$
10
  • $\begingroup$ Would you please post the data, or a link to the data? $\endgroup$ Commented Nov 11, 2019 at 23:33
  • 1
    $\begingroup$ See posts with the change-point tag. $\endgroup$
    – whuber
    Commented Nov 12, 2019 at 15:10
  • $\begingroup$ @JamesPhillips the data can be accessed via this link docs.google.com/spreadsheets/d/… Thanks! $\endgroup$
    – mokusei
    Commented Nov 12, 2019 at 16:45
  • $\begingroup$ @whuber Thanks for the reply! But I am more concerned about whether I can set a cutoff value k for the continuous variable x and then run a regression like y = a + b * x + c * dummy x ( x < k or x >= k). Also, a lot of articles and paper I found suggest it is problematic to categorize a continuous variable biostat.mc.vanderbilt.edu/wiki/Main/CatContinuous $\endgroup$
    – mokusei
    Commented Nov 12, 2019 at 16:55
  • $\begingroup$ You are asking to identify a single changepoint in a regression. This is not a matter of converting a continuous variable into a category: $x$ still enters directly into the model. $\endgroup$
    – whuber
    Commented Nov 12, 2019 at 17:19

1 Answer 1

0
$\begingroup$

Using the data linked to in the comments, you can do this in the R package mcp:

Define a model with two linear segments:

model = list(
  y ~ 1 + x,
  ~ 1 + x
)

Now sample it (setting adapt high to reach convergence) and test the hypothesis that the first slope is greater than the second. I get a evidence ratio (Bayes Factor) of around 1.5.

library(mcp)
fit = mcp(model, data = df, adapt = 4000)
hypothesis(fit, "x_1 > x_2")

Note that:

  • This dataset contains very little information about such a change point. Therefore it is hard to identify and the model fit is poor (poor convergence between chains). To help it along, maybe update the priors to better represent the knowledge about the data you are modeling, e.g., if the change point is known to occur in a certain interval or if the slopes are known to be positive.

  • Set segment 2 to ~ 0 + x if the slopes are joined.

Read more on the mcp website.

$\endgroup$

Your Answer

By clicking “Post Your Answer”, you agree to our terms of service and acknowledge you have read our privacy policy.

Not the answer you're looking for? Browse other questions tagged or ask your own question.