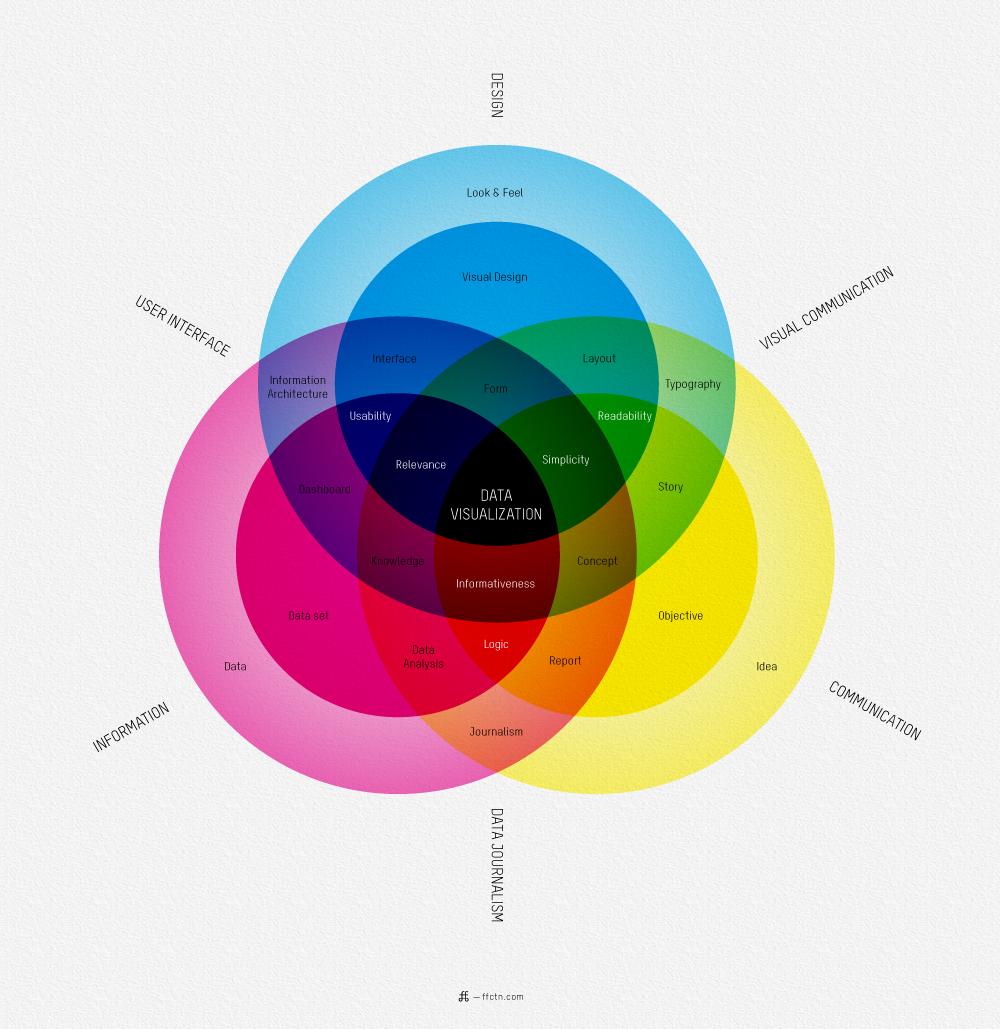
How would you explain data visualization and why it is important to a layman?
5 Answers
When I teach very basic statistics to Secondary School Students I talk about evolution and how we have evolved to spot patterns in pictures rather than lists of numbers and that data visualisation is one of the techniques we use to take advantage of this fact.
Plus I try to talk about recent news stories where statistical insight contradicts what the press is implying, making use of sites like Gapminder to find the representation before choosing the story.
I would explain it to a layman as:
Data visualization is taking data, and making a picture out of it. This allows you to easily see and understand relationships within the data much more easily than just looking at the numbers.
I would show them the raw data of Anscombe's Quartet (JSTOR link to the paper) in a big table, alongside another table showing the Mean & Variance of x and y, the correlation coefficient, and the equation of the linear regression line. Ask them to explain the differences between each of the 4 datasets. They will be confused.
Then show them 4 graphs. They will be enlightened.
From Wikipedia: Data visualization is the study of the visual representation of data, meaning "information which has been abstracted in some schematic form, including attributes or variables for the units of information"
Data viz is important for visualizing trends in data, telling a story - See Minard's map of Napoleon's march - possibly one of the best data graphics ever printed.
Also see any of Edward Tufte's books - especially Visual Display of Quantitative Information.
For me Illuminating the Path report has been always good point of reference.
For more recent overview you can also have a look at good article by Heer and colleagues.
But what would explain better than visualization itself?

(Source)
