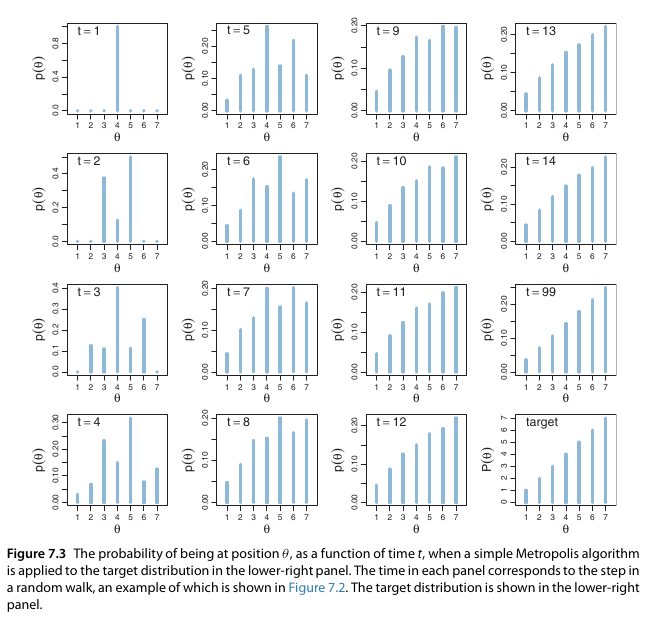
The following picture explains how the Random Walk Metropolis algorithm walk throughout time from $ t=1 $ to $ t=99 $.
At times $ t=1 $ and $ t=2 $, things are fine to understand, somehow, I am lost after time $ t=2 $. I don't think I understand how those histograms in the picture change over time after time $ t+1 $.
I thought that only two positions that are only one step further from the current position change but in the picture, the histogram of other positions changes, too. The calculation for the change of the histogram at time $ t=2 $ from time $ t=1 $ is explained. But I don't understand why histograms change the way as shown at time $ t=3 $. I'd be appreciated if you can show the way how the calculations are done up to $ t=3 $ or $ t=4 $.
The picture is from the book, "Doing Bayesian Data Analysis by John K, Kruschke" on page 150.

