2
$\begingroup$

I would like to determine whether the relationship between variable X and Y depends on the value of a third variable M. It's a psychological topic and unfortunately I've got a sample size of 30 persons only (survey consisting of Likert-scaled items). A colleague told me, instead of doing a moderator analysis, I shoud prefer a multiple regression. Is a multiple regression indeed a better choice? Why is that? Are there other models?

EDIT (the nature of my data in detail): The research is about the relationship between the level of engagement (predictor) of family caregivers of patients with mental disorders and the burden these caregivers experience (outcome). In general, higher levels of engagement are associated with higher experienced levels of burden. My hypothesis states, that caregivers, who are recognized and get actively involved by psychiatrists and therapists, experience relatively less burden than caregivers who are not allowed to participate by the professionals. So "participation" is seen as moderator here.

                   participation
                    (moderator)
                         v
engagement(predictor) -------> burden(outcome)

Nature of variables: engagement: 4-point Likert scale, 5 items participation: 5-point Likert scale, 9 items burden: 4-point Likert scale, 7 items

All scales are considered to be continuous.

$\endgroup$
2
  • 2
    $\begingroup$ Moderator analysis is simply a multiple regression with an interaction term, so the question with respect to regression seems to be whether to include M by itself or also in an interaction term with X. The nature of your data might suggest other modeling approaches. If Y is the outcome variable and X is a predictor, what's the nature of X? Is M a binary yes/no variable or something else? Is Y the result from a single Likert item with only a few levels or from a combination of Likert items into something more like a continuous scale? $\endgroup$
    – EdM
    Commented Dec 23, 2019 at 20:32
  • $\begingroup$ I added the nature of my hypothesis and data $\endgroup$
    – Madamadam
    Commented Dec 23, 2019 at 23:23

2 Answers 2

1
$\begingroup$

If your variables can all be treated as continuous and the predictors are linearly related to outcome, then consider the following 2 models:

$$ Y = \beta_0 + \beta_1X + \beta_2M + \beta_3XM+\epsilon,$$

and

$$ Y = \beta_0 + \beta_1X + \beta_2M+\epsilon,$$

where the $\beta$ values are linear regression coefficients and $\epsilon$ represents the error around the predictions from the linear model (errors ideally normally distributed and independent of the predicted values). The first model, a multiple regression with an interaction term, treats $M$ as a moderator as discussed on this page. That model allows for the value of $M$ to affect the sensitivity of $Y$ to changes in $X$, as a unit change of $X$ would then change the value of $Y$ by $(\beta_1+\beta_3M)$.

The second model, a multiple regression without an interaction term, still means that "the relationship between variable $X$ and $Y$ depends on the value of a third variable $M,$" but in a more restricted sense: just knowing the value of $X$ isn't sufficient to predict $Y,$ you need to add in the portion of the prediction based on the value of $M$. In the second model the sensitivity of $Y$ to changes in $X$ is the same regardless of the value of $M,$ however, with a unit change in $X$ always leading to a change of $\beta_1$ in $Y$. $M$ only affects the level of $Y,$ not the sensitivity of $Y$ to a change in $X.$

There is a rule of thumb in linear regression that you need about 10 cases per predictor to avoid overfitting. As the interaction term counts as a predictor the first model has 3 predictors, just at the limit of what might be considered acceptable with 30 cases. With only 30 cases you also are unlikely to find significant results unless the relationships of predictors to outcome are fairly strong. The second multiple regression model, with only 2 predictors, might have a better chance of finding a significant result while avoiding overfitting. That might be the point that your colleague was making.

So your choice depends on how you hypothesize that $M$ will affect the relationship between $X$ and $Y.$ If you think that $M$ will just shift the level of $Y$ at any value of $X$ then the second, simpler model is correct. If you think that $M$ also will affect the slope of the relationship between $Y$ and $X,$ then you need the full moderator analysis provided by the first model. That choice, with the associated trade-offs, depends on your knowledge of the subject matter.

$\endgroup$
1
  • $\begingroup$ Thank you very much, your answer clarified so much more for me! $\endgroup$
    – Madamadam
    Commented Jan 6, 2020 at 1:35
1
$\begingroup$

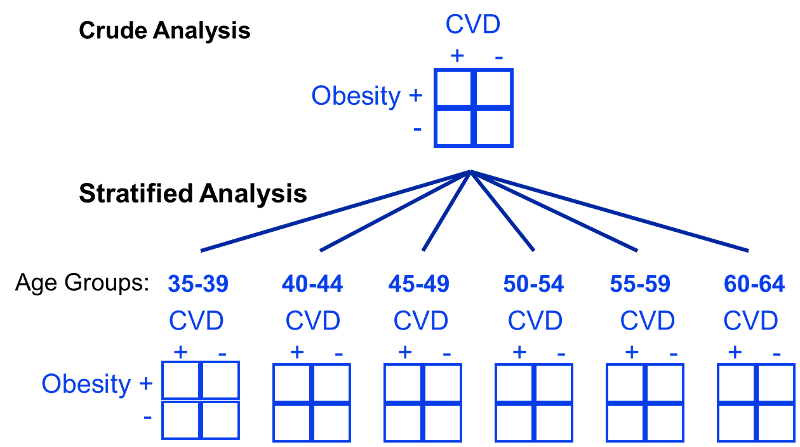
What is variable M? If it is categorical, you could potentially control for by stratifying your analysis, which would then require you to use stratified Fisher's exact test if cell sizes of expected values are at or less than 5. Seeing as your sample size is 30, there will definitely be some cell sizes at or below that number. If it is not categorical, I would consider splitting it into categories.

Let's make the picture below analogous to your study. X is obesity, and Y is Cardiovascular Disease (CVD). M would be age groups. So you are interested in age groups having an effect on the relationship of obesity and CVD. By separating where each subject falls into age group, and doing a Fisher's exact test from there, it will give you your relationship of X and Y, and how M changes the X / Y relationship over the categories of M.

Stratified analysis

$\endgroup$
2
  • $\begingroup$ I added the nature of my hypothesis and data. $\endgroup$
    – Madamadam
    Commented Dec 24, 2019 at 10:15
  • 1
    $\begingroup$ As all of your variables are non-binary, I suppose regression could be useful. However, the associations between your variables must be strong to account for the low power from low sample size. It shouldn't take you long to do a regression on these three variables, and if the results are statistically significant then they actually are significant, despite your sample size. Hope this helps. $\endgroup$ Commented Dec 24, 2019 at 13:38

Your Answer

By clicking “Post Your Answer”, you agree to our terms of service and acknowledge you have read our privacy policy.

Not the answer you're looking for? Browse other questions tagged or ask your own question.